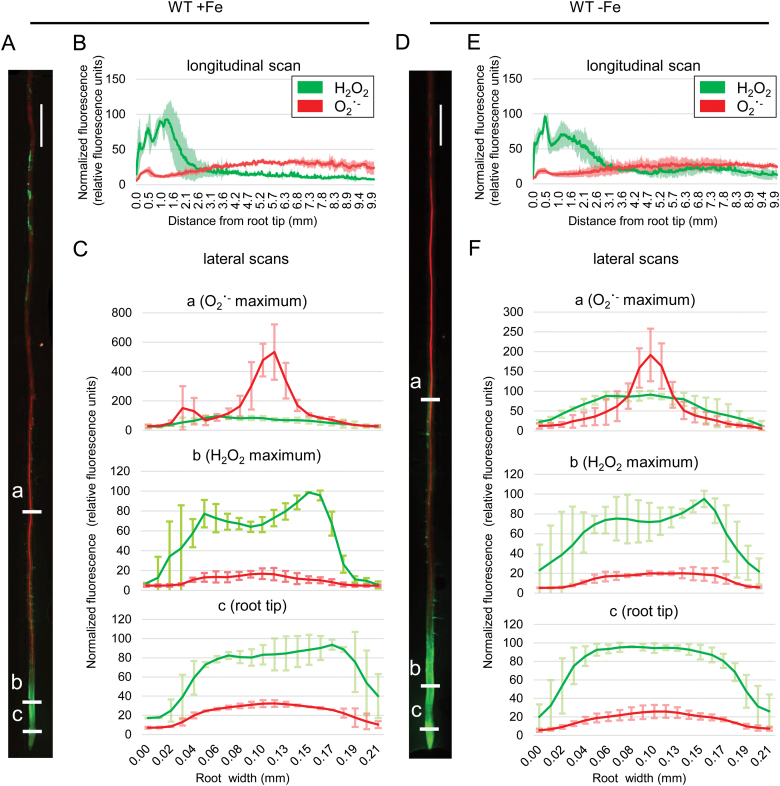
Fig. 2.
Histochemical H2O2 and O2˙ − staining in wild-type roots grown for 10 d under sufficient (+Fe) or deficient (–Fe) Fe supply. (A) Staining example of a root grown under +Fe. (B) Longitudinal signal intensity scan of roots grown under +Fe, ±SD. (C) Lateral signal intensity scans at three different positions, indicated as ‘a’, ‘b’, and ‘c’ in (A), of roots grown under +Fe. (D) Staining example of a root grown under –Fe. (E) Longitudinal signal intensity scan of roots grown under –Fe. (F) Lateral signal intensity scans at three different positions, indicated as ‘a’, ‘b’, and ‘c’ in (D), of roots grown under –Fe. All graphs represent averaged data from five roots, ±SD. Size bars in (A) and (D): 0.5 cm.

