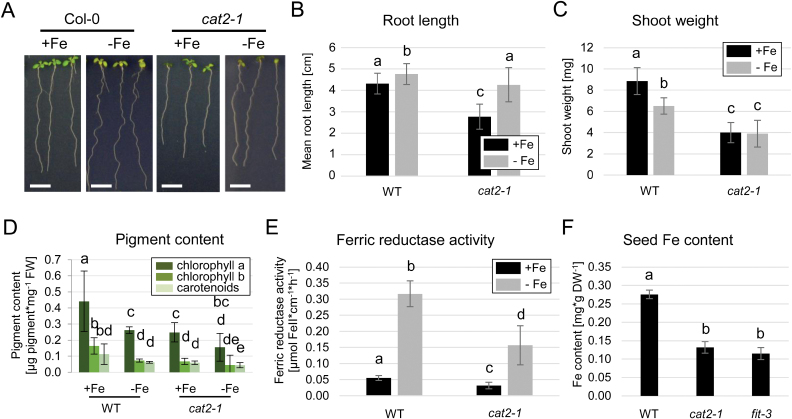
Fig. 5.
Fe-related phenotypes of cat2-1 mutant plants. (A) Representative images of wild-type and cat2-1 plants grown for 10 d under sufficient (+Fe) or deficient (–Fe) Fe supply. Size bars=1 cm. (B) Root length quantification (n=27–32). (C) Shoot weight quantification (n=6). (D) Photosynthetic pigment quantification (n=6). (E) Ferric reductase activity (n=6). (F) Seed Fe content of soil-grown wild-type, cat2-1, and fit-3 plants (n=3). (B–E) Bars represent mean values ±SD. Different letters indicate statistically significant differences (P<0.05).

