
Figure 2.
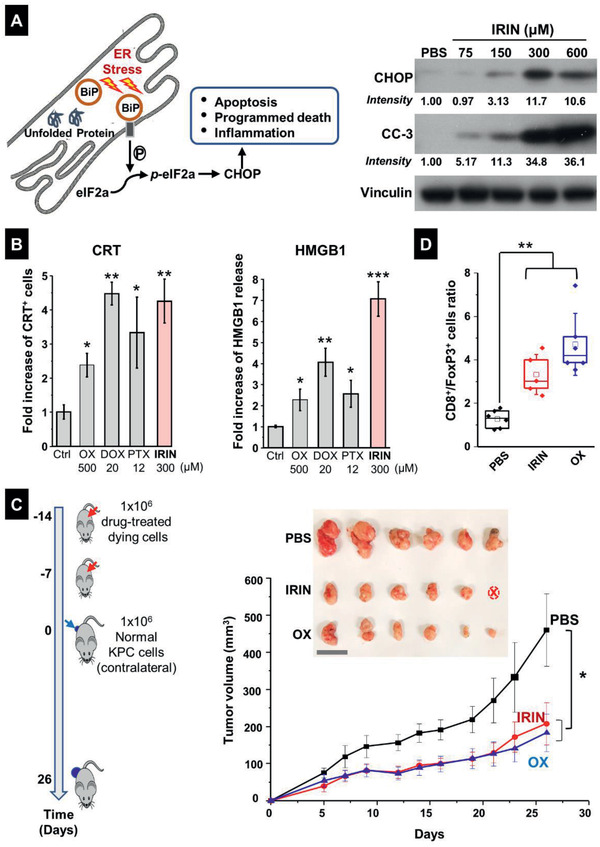
Assessment of ER stress responses induced by free IRIN in KPC cells. A) Left: Simplified schematic to show the unfolded protein stress response in the ER. Right: immunoblotting to show the expression of the ER stress response marker CHOP and cleaved caspase 3 (CC‐3) in KPC cells treated with IRIN for 24 h. B) CRT expression was assessed by flow cytometry (left panel), while HMGB1 release was determined by ELSLA (right panel) in KPC cells exposed to OX (500 × 10−6 m), IRIN (300 × 10−6 m), DOX (20 × 10−6 m), and PTX (12 × 10−6 m) for 24 h. Data are expressed as mean ± SD. n = 3. *p < 0.05; **p < 0.01; ***p < 0.001 compared to PBS control (Student's t‐test). C) Vaccination experiment in a PDAC mouse model. Left: The schematic shows execution of the vaccination study through subcutaneous injection of dying KPC cells treated with IRIN or OX, followed by rechallenge with untreated KPC cells. As a negative control in the vaccination experiment, mice were treated with PBS only, without cellular debris. Right: Tumor growth curves of normal KPC cells, injected in the opposite flank of the vaccinated animals. Data are expressed as mean ± SEM. n = 6. Insert: Photography of the harvested tumors collected for each group. Note that there was one tumor free animal in the IRIN group (labeled as “ⓧ”). Bar: 2 cm. D) Quantitative assessment of CD8+/FoxP3+ cell ratios by IHC analysis. *p < 0.05; **p < 0.01 (1‐way ANOVA followed by a Tukey's test).