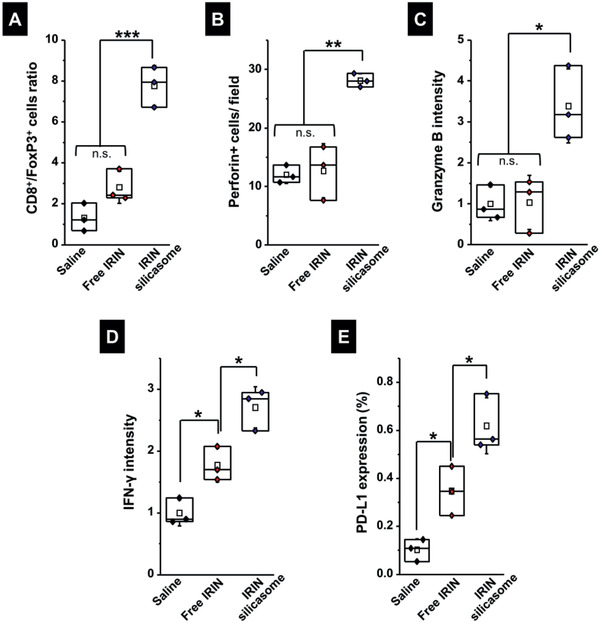
Figure 6.

Analysis of cognate immunity in the efficacy experiment in Figure 5. Additional IHC analysis was undertaken using the tumor samples collected in Figure 5A. Quantitative assessment of: A) the CD8+/ FoxP3+ cell ratio; B) perforin; C) granzyme B; D) IFN‐γ production; and E) PD‐L1 expression. Representative IHC images appear in Figure S11A–C (Supporting Information). Data are expressed as mean ± SEM, n = 3. *p < 0.05; **p < 0.01; ***p < 0.001 (1‐way ANOVA followed by a Tukey's test).
