Figure 4.

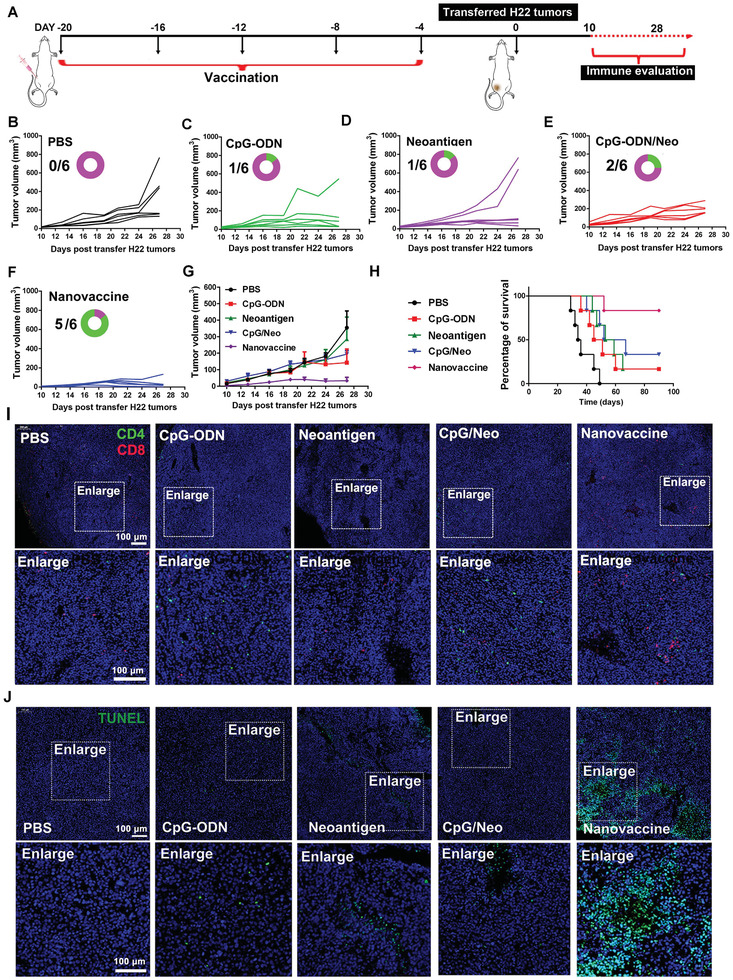
In vivo prevention of H22 tumor growth and prolonging the survival rate of H22 tumor‐bearing mice. A) Schematic illustration of inoculation procedure of thiolated nano‐vaccine. B–G) The tumor volume changes in H22‐tumor bearing BALB/c mice after inoculation with PBS, CpG‐ODN, neoantigen, the mixture of CpG‐ODN and neoantigen, and the thiolated nano‐vaccine for five times per 4d (the circular ring and number represent the survival of mice). H) Survival curve of H22 tumor‐bearing mice (n = 6 for all groups) after received different treatment as indicated. I) CLSM images of TILs inside the tumors at the 20th d after received different treatment as indicated. Red fluorescence represented CD8+T cells. Green fluorescence represented CD4+T cells and blue fluorescence represented nucleus. J) TUNEL staining of tumor slices at the 20th d after H22 tumor cell transfer.
