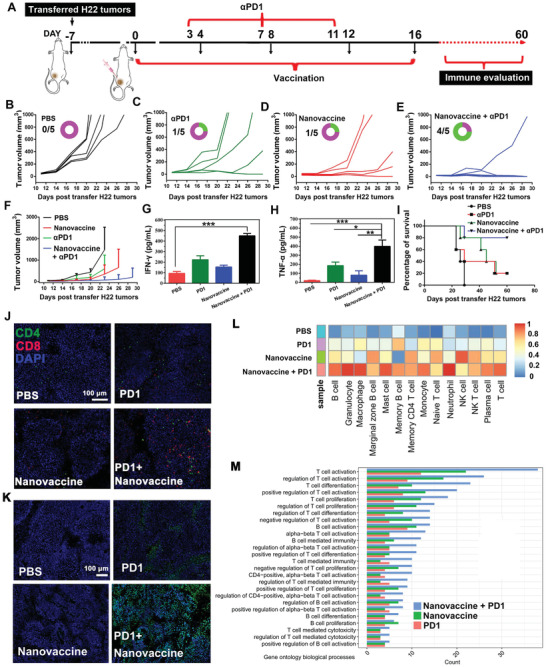
Figure 5.

In vivo elimination of established primary tumors and prevention of tumor re‐challenge. A) Schematic illustration of thiolated nano‐vaccine inoculation procedure and PD‐1 antibody administration procedure in the established H22 tumor‐bearing mice. B–F) The tumor volume changes in H22‐tumor bearing BALB/c mice after thiolated nano‐vaccine inoculation for five times per 4 d or/and αPD1 for three times per 4 d, respectively. The PBS treated mice were set as the control. H) The tumor volume change along with time in each treated group. The secretion of G) IFNγ and H) TNF‐α in tumors. The statistical analysis was performed with ANOVA analysis. Results are shown as mean ± SD. *p < 0.05, **p < 0.01, ***p < 0.001 (n = 5). I) Survival curves of the H22 tumor‐bearing mice (n = 5 for all groups) after immunization and treatment as indicated. J) CLSM images of tumor‐infiltrating lymphocytes (TILs) in tumor tissues at the 20th d after receiving different treatment as indicated. Red fluorescence was CD8+T cells. Green fluorescence was CD4+T cells. K) TUNEL staining of tumor slice at the 20th d after received different treatment as indicated. L) Heat map analysis of ex tumors after receiving different treatment as indicated through Transcriptome Sequencing (RNA‐seq). Scale bar of 1 represents the total percentage of samples as indicated. M) Gene ontology biological process analysis of ex tumors after received different treatment as indicated.
