Figure 2.

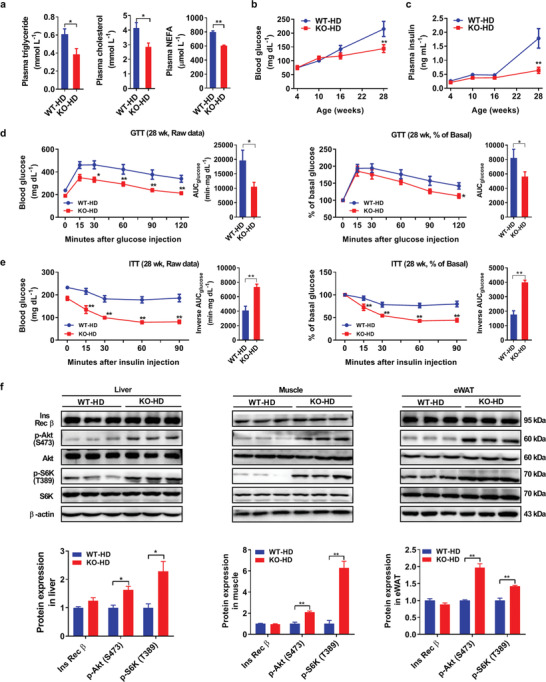
AKAP1‐deficient mice show the improved metabolic profile on a HFD. a) Plasma triglyceride, cholesterol, and nonesterified fatty acid (NEFA) levels of WT and AKAP1−/− mice on HFD for 24 weeks (n = 6–8 mice per group). WT‐HD: wild‐type HFD mice; KO‐HD: knockout HFD mice. b,c) Blood glucose and plasma insulin levels of WT and AKAP1−/− mice on HFD (n = 6 mice per group). d,e) Raw data of glucose tolerance test (GTT) and insulin tolerance test (ITT) in WT and AKAP1−/− mice on HFD for 24 weeks (left); blood glucose during GTT or ITT was expressed as a percentage of basal (right). The corresponding area under the curve (AUC) was calculated for each mouse from both groups. n = 7 mice per group. f) Western blotting analysis of Ins Rec β, p‐Akt (S473), Akt, p‐S6K (T389), and S6K expression in liver, muscle, and eWAT from WT and AKAP1−/− mice on a HFD for 24 weeks which were sacrificed 15 min after i.p. injection of insulin (5 U kg−1). β‐actin was used as a loading control (n = 3 mice per group). Data were expressed as mean ± SEM. Student's t‐test was used for analysis of the data in (a), (d) (AUC), (e) (AUC), and (f). Two‐way ANOVA with Bonferroni's post hoc test was used in (b–d) (raw data, % of basal in GTT) and (e) (raw data, % of basal in ITT). *p < 0.05, **p < 0.01.
