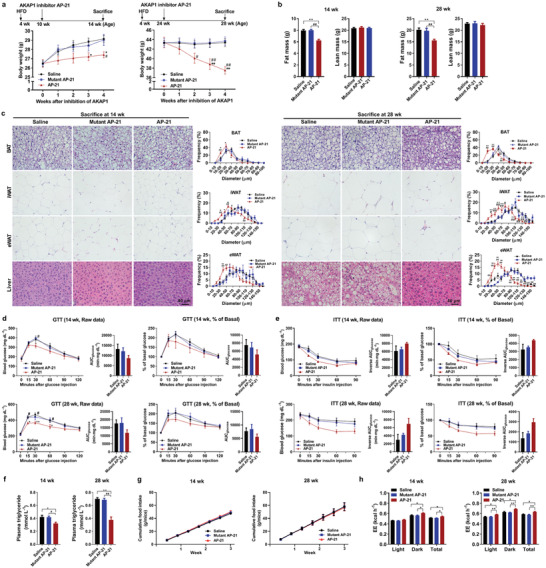
Figure 8.

AKAP1 inhibitor effectively alleviates diet‐induced obesity and insulin resistance. a) Body weight of HFD‐treated mice injected with AKAP1 inhibitor AP‐21, saline, or mutant AP‐21 (n = 10–12 mice per group). b) Fat mass and lean mass of HFD‐treated mice injected with AKAP1 inhibitor, saline, or mutant AP‐21 (n = 8–10 mice per group). c) Representative H&E‐stained sections of BAT, iWAT, eWAT, and liver dissected from HFD mice treated with saline, mutant AP‐21, or AP‐21 at early and late phases (left). Scale bar, 40 µm. Distribution of adipocyte diameter (μm) in BAT, iWAT, and eWAT from HFD mice treated with saline or AP‐21 at early and late phases (right). n = 6–9 mice per group. d,e) Raw data of GTT and ITT in HFD‐treated mice injected with AKAP1 inhibitor (left); blood glucose during GTT or ITT was expressed as a percentage of basal (right). The AUC was calculated for each mouse from all groups. n = 5 mice per group. f) Plasma triglyceride level of HFD‐treated mice injected with saline or AP‐21 at early and late phases (n = 5–6 mice per group). g) Cumulative food intake of HFD mice with treatments as indicated was measured every 3 days from 10 to 13 weeks of age and 24 to 27 weeks of age, respectively (n = 5–8 mice per group). h) EE was estimated by the amount of O2 consumption and CO2 production in HFD‐treated mice injected with AKAP1 inhibitor (n = 4 mice per group). Data were expressed as mean ± SEM. Two‐way ANOVA with Bonferroni's post hoc test was used in (a), (c), (d) (raw data, % of basal in GTT), (e) (raw data, % of basal in ITT), and (g). One‐way ANOVA with Bonferroni's post hoc test was used in (b), (d) (AUC), (e) (AUC), and (f). ANCOVA with body weight as the covariate was used in (h). *p < 0.05, **p < 0.01, AP‐21 versus saline; # p < 0.05, ## p < 0.01, AP‐21 versus mutant AP‐21.
