Figure 4.

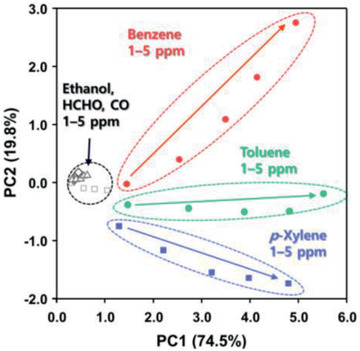
PCA plot using the data from 0.5Rh‐TiO2/SnO2, 1Rh‐TiO2/SnO2, and 2Rh‐TiO2/SnO2 sensors to demonstrate the discrimination of aromatic BTX compounds over the interferences from ethanol, HCHO, and CO (concentration: 1–5 ppm).

PCA plot using the data from 0.5Rh‐TiO2/SnO2, 1Rh‐TiO2/SnO2, and 2Rh‐TiO2/SnO2 sensors to demonstrate the discrimination of aromatic BTX compounds over the interferences from ethanol, HCHO, and CO (concentration: 1–5 ppm).