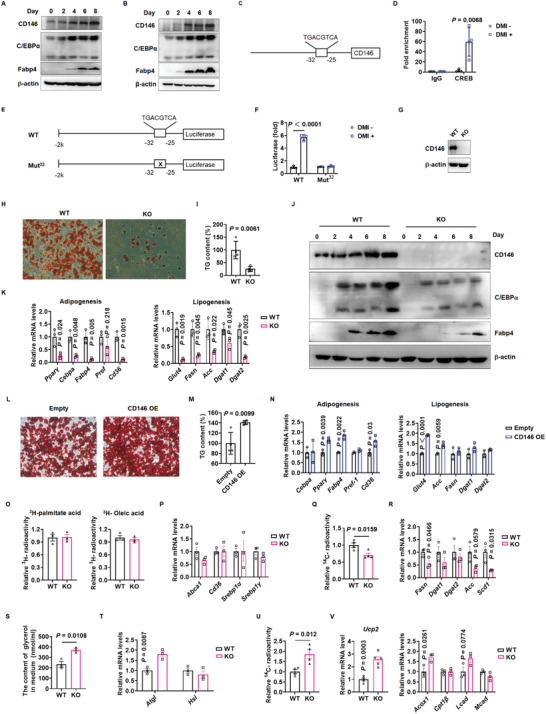
Figure 5.

CD146 promotes adipogenesis and lipid accumulation. Western blot showing CD146, C/EBPα, and Fabp4 expression during the differentiation of stromal vascular fractions (SVF) A) and 3T3‐L1 cells B). C) Schematic diagram illustrating a putative CREB binding site in the CD146 promoter. D) ChIP‐qPCR analysis showing CREB binding to the CD146 promoter during DMI‐induced 3T3‐L1 differentiation. E) Schematic diagram of luciferase reporter constructs, wherein luciferase is driven by the CD146 promoter with a WT or deleted putative CREB binding site. F) Dual luciferase reporter assay confirming that CREB binds to the CD146 promoter during DMI‐induced 3T3‐L1 differentiation. CD146 expression G), oil‐red‐O staining H) and TG content I) of adipocytes differentiated from WT and CD146 KO SVF. J) Western blot showing CD146, C/EBPα, and Fabp4 expression during adipocyte differentiation from SVF. K) RT‐qPCR showing the expression of adipogenesis and lipogenesis‐related genes in adipocytes differentiated from SVF. L) Oil‐red‐O staining of adipocytes differentiated from 3T3‐L1 cells with ectopic CD146 expression. M) Triglyceride content in adipocytes differentiated from 3T3‐L1 cells with ectopic CD146 expression. N) RT‐qPCR analysis of adipogenesis and lipogenesis‐related gene expression in adipocytes differentiated from 3T3‐L1 cells. O) Lipid uptake measured in WT and CD146 KO adipocytes (n = 3 per group). P) RT‐qPCR analysis of lipid uptake‐related gene expression in WT and CD146 KO adipocytes (n = 3 per group). Q) 14C radioactivity indicating lipogenesis rate in WT and CD146 KO adipocytes (n = 4 per group). R) RT‐qPCR analysis of lipogenesis‐related gene expression in WT and CD146 KO adipocytes (n = 3 per group). S) Glycerol release measurements indicating lipolysis rate in WT and CD146 KO adipocytes (n = 3 per group). T) RT‐qPCR analysis of lipolysis‐related gene upregulation in WT and CD146 KO adipocytes (n = 3 per group). U) 14C radioactivity indicating fatty acid oxidation rate in WT and CD146 KO adipocytes (n = 4 per group). V) RT‐qPCR analysis of fatty acid oxidation‐related gene expression in WT and CD146 KO adipocytes (Ucp2, n = 5 per group; other genes, n = 3 per group). Data represent the mean ± SD in (A)–(N) and mean ± SEM in (O)–(V). P values were determined using Student's t‐tests.
