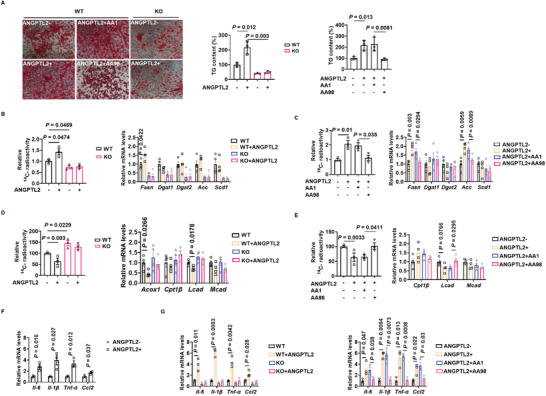
Figure 7.

ANGPTL2‐CD146 interaction regulates adipogenesis, lipid metabolism, and adipose inflammation. A) Oil‐red‐O staining and triglyceride (TG) content of adipocytes differentiated from WT and CD146 KO SVF treated with ANGPTL2 and anti‐CD146 AA98 or AA1 antibodies. B) 14C radioactivity (left) and lipogenesis‐related gene expression (right) in WT and CD146 KO adipocytes treated with ANGPTL2 (14C radioactivity, n = 3 per group; gene expression, n = 4 per group). C) 14C radioactivity (left) and lipogenesis‐related gene expression (right) in adipocytes treated with ANGPTL2 and anti‐CD146 AA98 or AA1 antibodies (14C radioactivity, n = 3 per group; gene expression, n = 4 per group). D) 14C radioactivity (left) and fatty acid oxidation‐related gene expression (right) in WT and CD146 KO adipocytes treated with ANGPTL2 (14C radioactivity, n = 3 per group; gene expression, n = 4 per group). E) 14C radioactivity (left) and fatty acid oxidation‐related gene expression (right) in adipocytes treated with ANGPTL2 and anti‐CD146 AA98 or AA1 antibodies (14C radioactivity, n = 3 per group; gene expression, n = 4 per group). F) RT‐qPCR analysis of proinflammatory factor Il‐6, Il1‐β, Tnf‐α, and Ccl2 upregulation in adipocytes treated with ANGPTL2 (n = 3 per group). G) RT‐qPCR analysis of proinflammatory factor Il‐6, Il1‐β, Tnf‐α, and Ccl2 expression in adipocytes treated with ANGPTL2 and anti‐CD146 AA98 or AA1 antibodies (n = 3 per group). Data represent the mean ± SD in (A) and mean ± SEM in (B)–(G). P values were determined using Student's t‐tests in (F) and two‐way ANOVA in (A–E) and (G).
