
Figure 4.
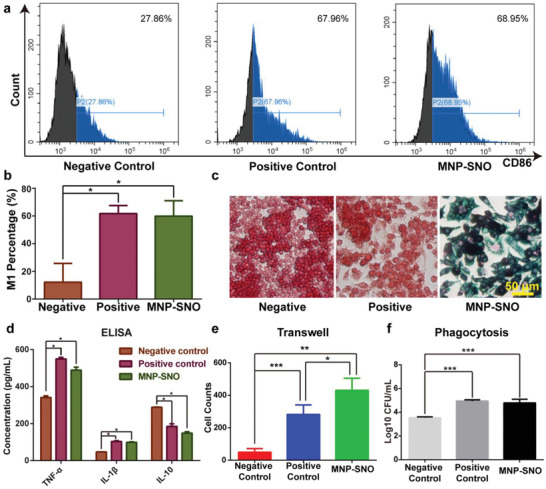
In vitro immunomodulation assay of magnetic nanoparticles. a) Flow cytometry results of RAW264.7 (CD86 is the marker for M1) from negative control (treated with 20 µL PBS for 24 h), positive control (treated with 10 µg L−1 LPS for 24 h), and MNP‐SNO (treated with 2.5 mg mL−1 MNP‐SNO for 24 h) groups, and b) the quantitative analysis of M1 macrophage percentage in three groups (n = 3, * P < 0.05 using one‐way ANOVA). c) Perl's blue staining images of RAW264.7 cells cocultured with PBS, LPS, or MNP‐SNO. The nuclei of macrophages were stained in red, and the iron element in cells was stained with Perl's blue (scale bar: 50 µm). d) ELISA results of cytokines (TNF‐α, IL‐1β, and IL‐10) secreted by RAW264.7 in different groups (n = 3, * P < 0.05 using one‐way ANOVA). e) Cell counts of the migrated RAW264.7 cultured on transwells (n = 3, * P < 0.05, ** P < 0.01, and *** P < 0.001 using one‐way ANOVA, Tukey's multiple comparisons test). f) Counted results of phagocytized S. aureus by RAW264.7 treated in different conditions (n = 3, *** P < 0.001 using one‐way ANOVA).