Figure 5.

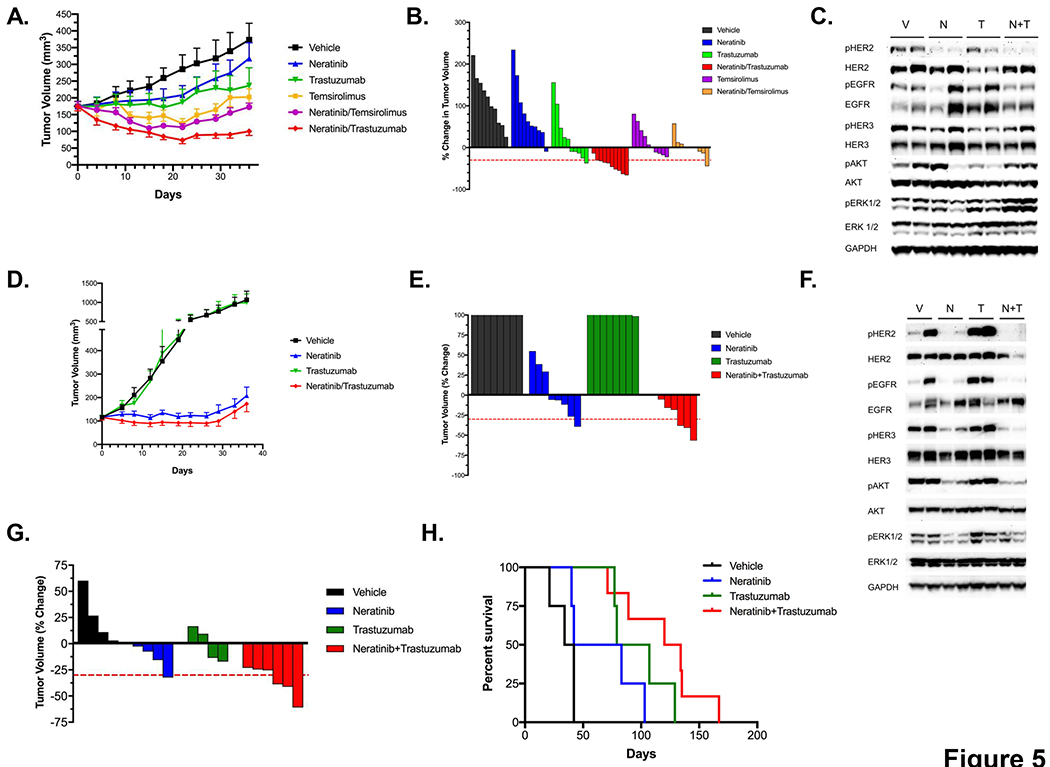
Evaluation of the neratinib/trastuzumab combination in vivo. A. Tumor volumes (TV; mean +/− SEM) over time of PDX DFCI 359 dosed with neratinib (40mg/kg), trastuzumab (20 mg/kg), temsirolimus (20 mg/kg), and their combinations (n = 8 mice/cohort). B. Waterfall plot of PDX DFCI 359 (% change in TV) following 4 weeks of treatment with neratinib, trastuzumab, temsirolimus, or their combinations. C. Pharmacodynamic study in DFCI 359 following treatment with vehicle (V), neratinib (N), trastuzumab (T) or with the combination of neratinib and trastuzumab (N+T). Cell extracts were immunoblotted to detect the indicated proteins. D. Tumor volumes (mean +/− SEM) over time of PDX DFCI 315 treated in vivo with neratinib (40 mg/kg), trastuzumab (20 mg/kg) or with the combination of both agents (n=8mice/cohort). E. Waterfall plot of PDX 315 following 4 weeks of treatment using drugs in C. F. Pharmacodynamic study in DFCI 315 following treatment with vehicle (V), neratinib (N), trastuzumab (T) or with the combination of neratinib and trastuzumab (N+T). Cell extracts were immunoblotted to detect the indicated proteins. G. Waterfall plot of HER2 YVMA GEMs following 2 weeks of treatment with with vehicle (n=4) neratinib (40 mg/kg; n=4), trastuzumab (20 mg/kg; n=4) or with the combination of both drugs (n=6). H. Kaplan-Mayer survival curve of mice in F. treated with the indicated drugs.
