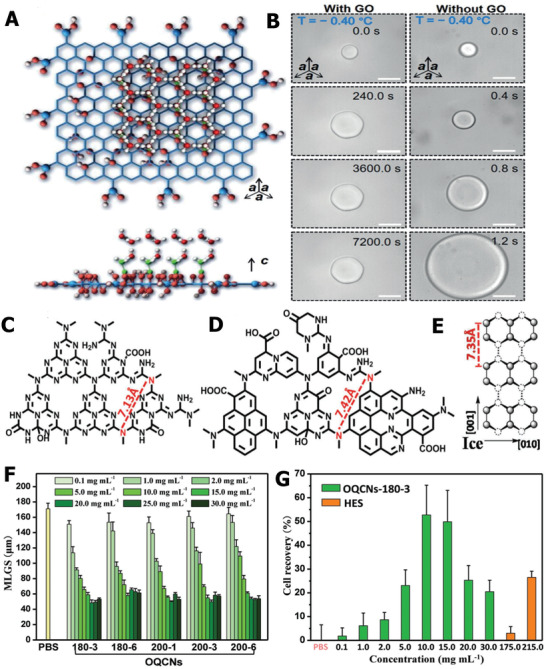
Figure 7.

Ice‐inhibition performance of GO and OQCNs and their applications for cell cryopreservation. A) The honeycomb‐like structure of GO matched with ice lattice and the formation of hydrogen bonds between ice crystals and hydroxy groups. B) The influence of GO on the growth and shape of ice crystals. A,B) Reproduced with permission.[ 123 ] Copyright 2016, Wiley‐VCH. C) Molecule structure of OCNs. D) Molecule structure of OQCNs. E) Primary prism face of hexagonal ice crystal. F) Comparison of the ice‐grain area with different concentrations of OQCN in PBS solution. G) The quantitative assessment of cryopreservation efficiency using OQCNs. C–G) Reproduced with permission.[ 70 ] Copyright 2017, Wiley‐VCH.
