
Fig. 4.
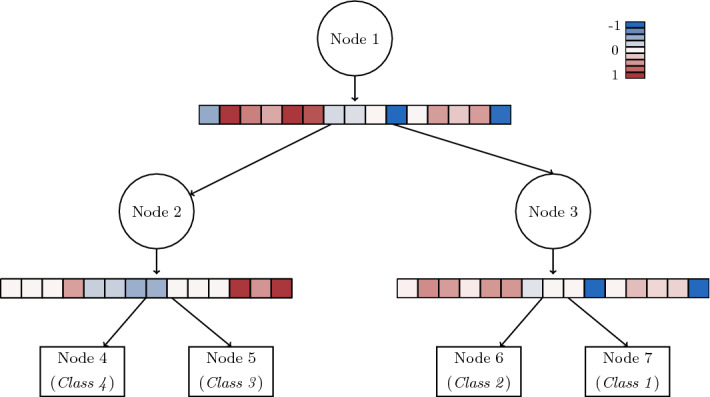
Illustration of Optimal Randomized Classification Tree for carevaluations, with . The classification accuracy of this model is , while of the predictor variables are used across the tree as well as in each of the three branch nodes. The magnitude of the coefficients of the splitting rule in each branch node is visualized with a heatmap. The heatmap transitions from blue for negative coefficients, to red for positive ones, while white is chosen for values close to 0