Figure 2.
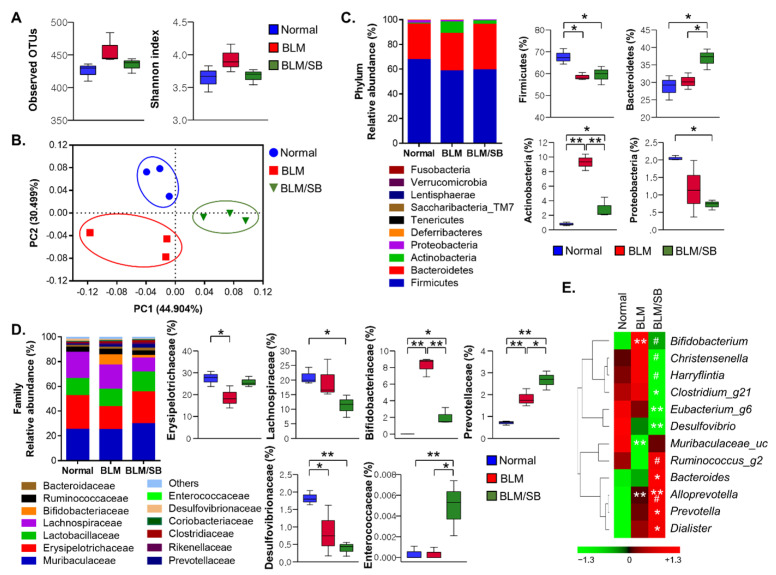
Composition of fecal microbiota. Bleomycin (BLM) was injected subcutaneously for two weeks. Sodium butyrate (SB) was administered orally from two weeks before BLM injection and feces were then obtained. The 16S sequences of fecal microbiota were analyzed in normal and BLM ± SB mice. (A) Microbiota richness estimated by the number of operational taxonomic units (OTUs) and Shannon index. (B) Microbiota diversity evaluated by principal coordinate analysis plots of UniFrac distances. (C,D) The overall composition of gut microbiota (left) and statistically significant changes (right) at the phylum level (C) and at the family level (D). (E) Heatmap of differentially abundant microbial genera among groups. Color represents normalized (z-score) relative abundance of bacteria from green (low abundance) to red (high abundance) (E). n = 3/group; each symbol represents one mouse. * p < 0.05, ** p < 0.01 in (C,D). * p < 0.05, ** p < 0.01 vs. normal, # p < 0.05 vs. BLM in (E).

