Figure 1.
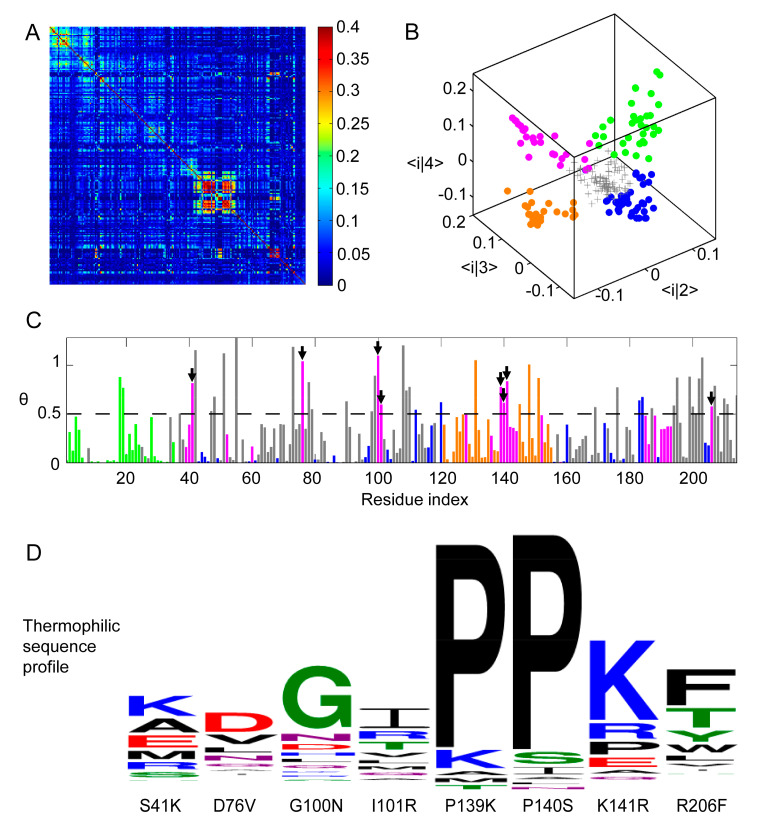
Residue Correlation Analysis (RCA) of Protein Sectors in ADK Family. (A) Heat map representation of RCA matrix rij for MSA of ADK. X− and y−axis coordinates both correspond to residue indices of ADK from E. coli, which has 214 residues. (B) Three dimensional scatter plot of the 214 residues in the space formed by the three eigenvectors of the second, the third, and the fourth largest eigenvectors. Each data point represented one position. After eliminating randomized background residues (gray), the rest of the positions could be clustered into four sectors, colored green, blue, orange, and magenta. (C) The relative entropy angle θ of thermophilic and mesophilic sequence profile at each position. Bars were colored by sectors. Residues whose angles were larger than 0.5 in the magenta sector were selected for further mutation (marked by arrow heads). (D) Amino acid distribution of thermophilic sequences at the chosen mutation positions. The first series of single-point mutations were S41K, D76V, G100N, I101R, P139K, P140S, K141R, and R206F.

