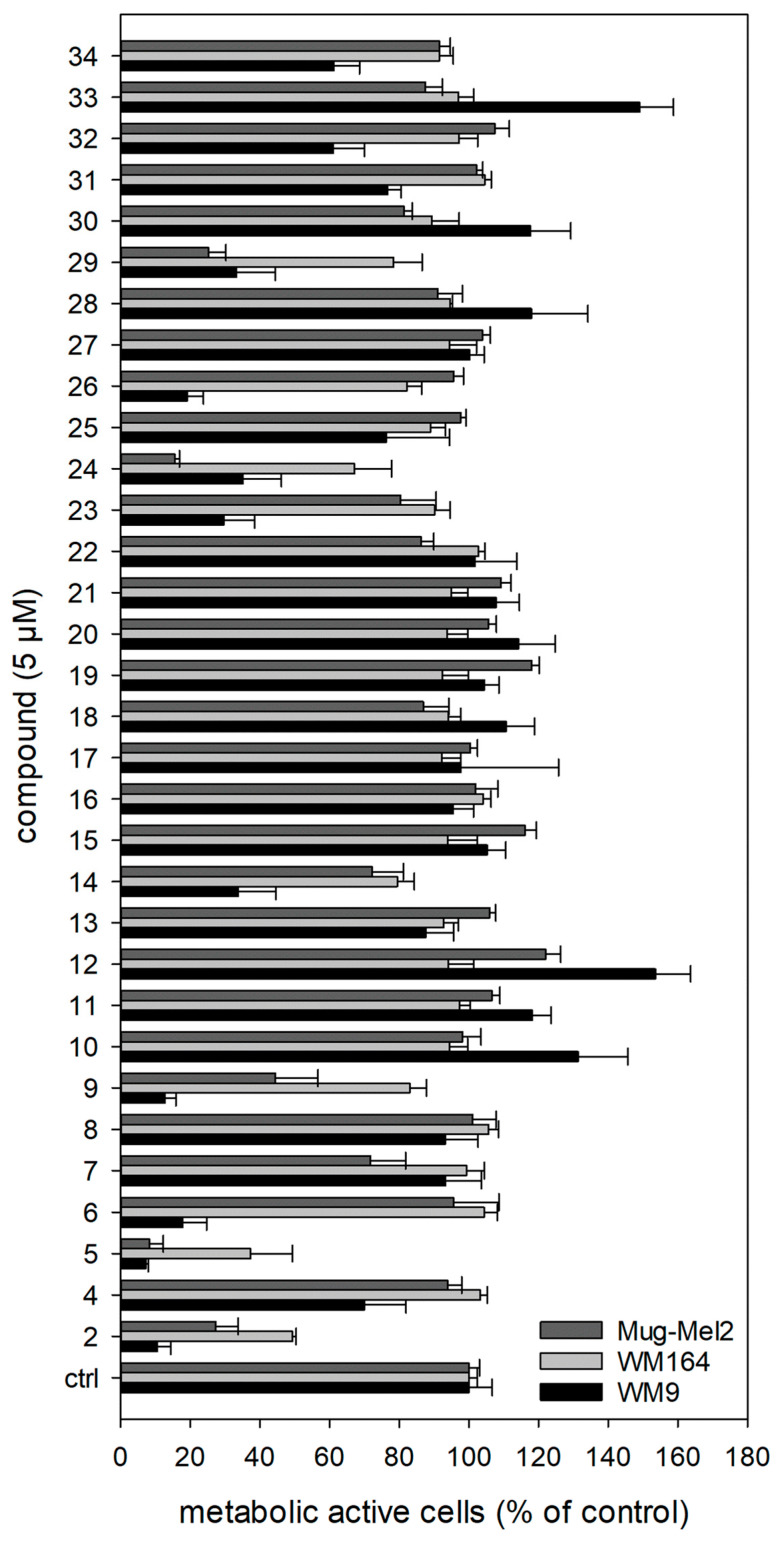
Figure 5.
Results of the XTT assay. For clarity reasons, only the results of the treatment with 5.0 µM for 72 h are shown. The complete results can be found in the Supplementary Material (Figures S1 and S2). 2 was tested as a reference at 5.0 µM. The strongest cytotoxicity was found for 5 (n = 6, mean ± sem). Vinblastine was used as positive control. At a concentration of 0.01 nM, it reduced the cell viability compared to control cells to: WM9 cells: 23.8 ± 1.5%, WM164 cells: 59.4 ± 4.4 %, and MUG-Mel2 cells: 65.0 ± 6.9 % (n = 6, mean ± sem, 72 h of treatment).

