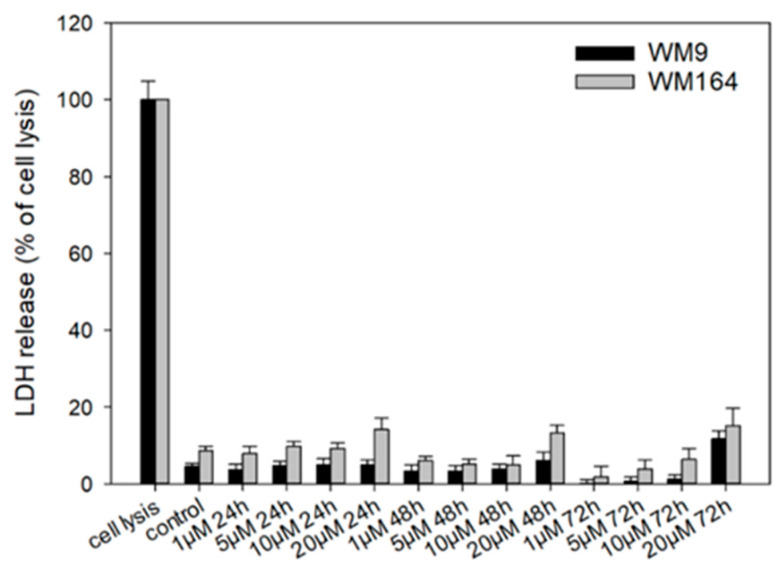
Figure 7.
Results of the LDH assay. WM9 and WM164 cells were treated with 1 µM, 5 µM, 10 µM, and 20 µM of 5 for 24 h, 48 h, or 72 h (n = 9, mean ± sem). Results are displayed as percentage of cell lysis. Control = vehicle treated cells (0.5% EtOH). Only at 20 µM, slight increases in LDH release were found.

