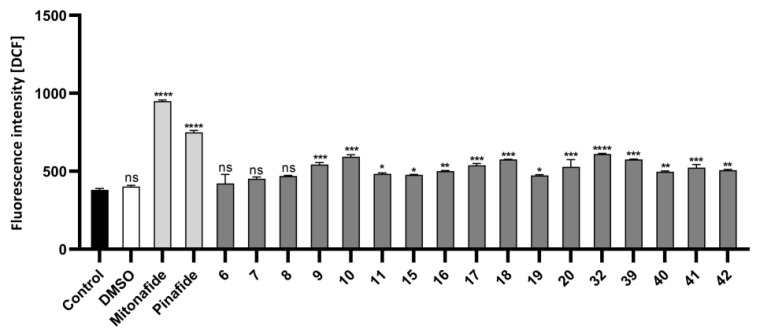
Figure 5.
ROS production in HepG2 cells after 24 h of incubation with compounds 6 (57.5 µM), 7 (52 µM), 8 (2 µM), 9 (1.5 µM), 10 (4 µM), 11 (2.5 µM), 15 (34 µM), 16 (30.7 µM), 17 (4.9 µM), 18 (7.5 µM), 19 (7.2 µM), 20 (6 µM), 32 (20.4 µM), 39 (5.3 µM), 40 (6.3 µM), 41 (5.2 µM), and 42 (3 µM). The concentration chosen for each compound corresponded to half of its IC50 value. Intracellular ROS production was measured by dual staining with H2DCFDA/PI. The intensity of DCF fluorescence corresponded to the intracellular level of ROS in HepG2 cells. Mean fluorescence intensity was measured by flow cytometry. Data are presented as mean ± SD of three independent experiments. Statistical significance is indicated by asterisks: (ns) p > 0.05, (*) p < 0.05, (**) p < 0.01, (***) p < 0.001, and (****) p < 0.0001.

