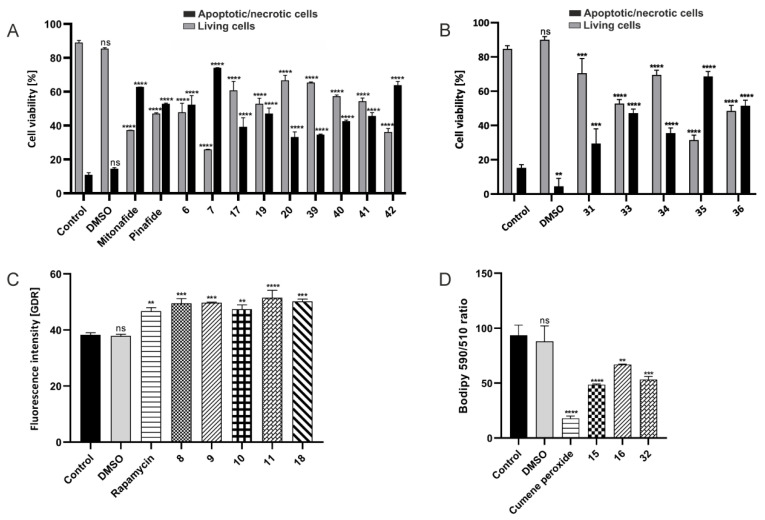
Figure 6.
Effect of compound 6 (115 µM), 7 (104 µM), 8 (4 µM), 9 (3 µM), 10 (8 µM), 11 (5 µM), 15 (68 µM), 16 (61 µM), 17 (10 µM), 18 (15 µM), 19 (14 µM), 20 (12 µM), 31 (53 µM) 32 (42 µM), 33 (5 µM), 34 (8.5 µM), 35 (9 µM), 36 (6 µM), 39 (11 µM), 40 (13 µM), 41 (10 µM), and 42 (6 µM) on cell death in HepG2 cells. The cells were treated with these compounds at a concentration corresponding to the whole IC50 value. Quantitative flow cytometry analysis was performed to evaluate apoptosis (A,B), autophagy (C), and ferroptosis (D) induced by compounds after 24 h of treatment. Data are presented as mean ± SD of three independent experiments. Statistical significance is indicated by asterisks: (ns) p > 0.05, (**) p < 0.01, (***) p < 0.001, and (****) p < 0.0001.

