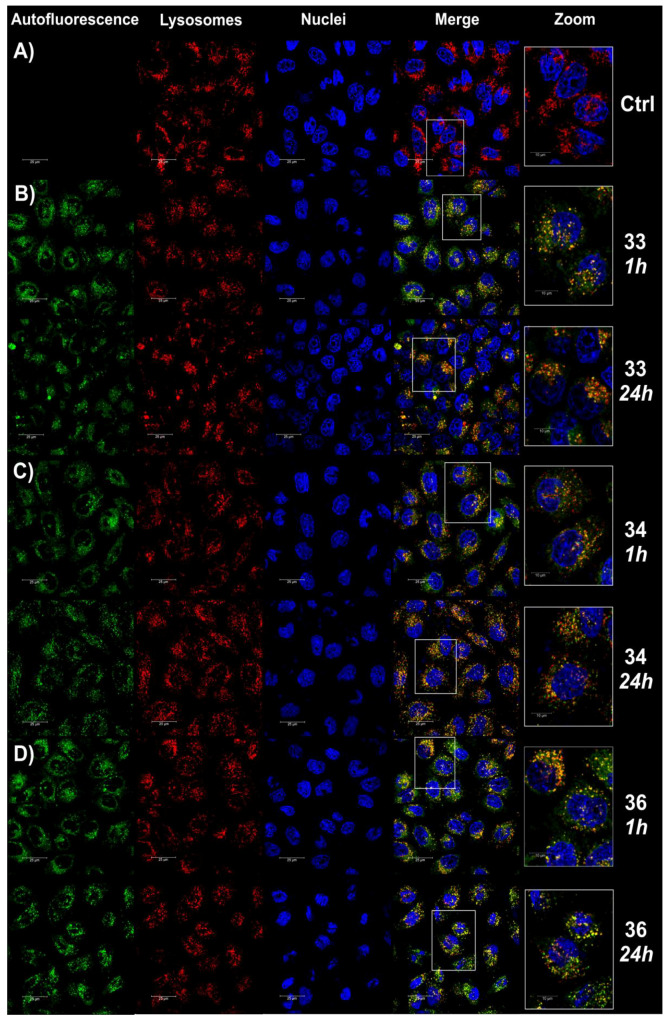
Figure 7.
Confocal microscopy analysis of the co-localization of compounds 33, 34, and 36. The analysis was carried out after 1 and 24 h of treatment of the cells with compounds 33 (B), 34 (C) and 36 (D) at the final concentration corresponding to the whole IC50 values. Untreated cells were used as a control (A). Panels with green fluorescence show the autofluorescence of the investigated compounds (Ex/Em 488/500–600 nm), panels with red fluorescence show the autofluorescence of stained lysosomes (Ex/Em 561/585–655 nm), and panels with blue fluorescence present nuclei labeling (Ex/Em 405/430–480 nm). Merged images are shown in the right panels.

