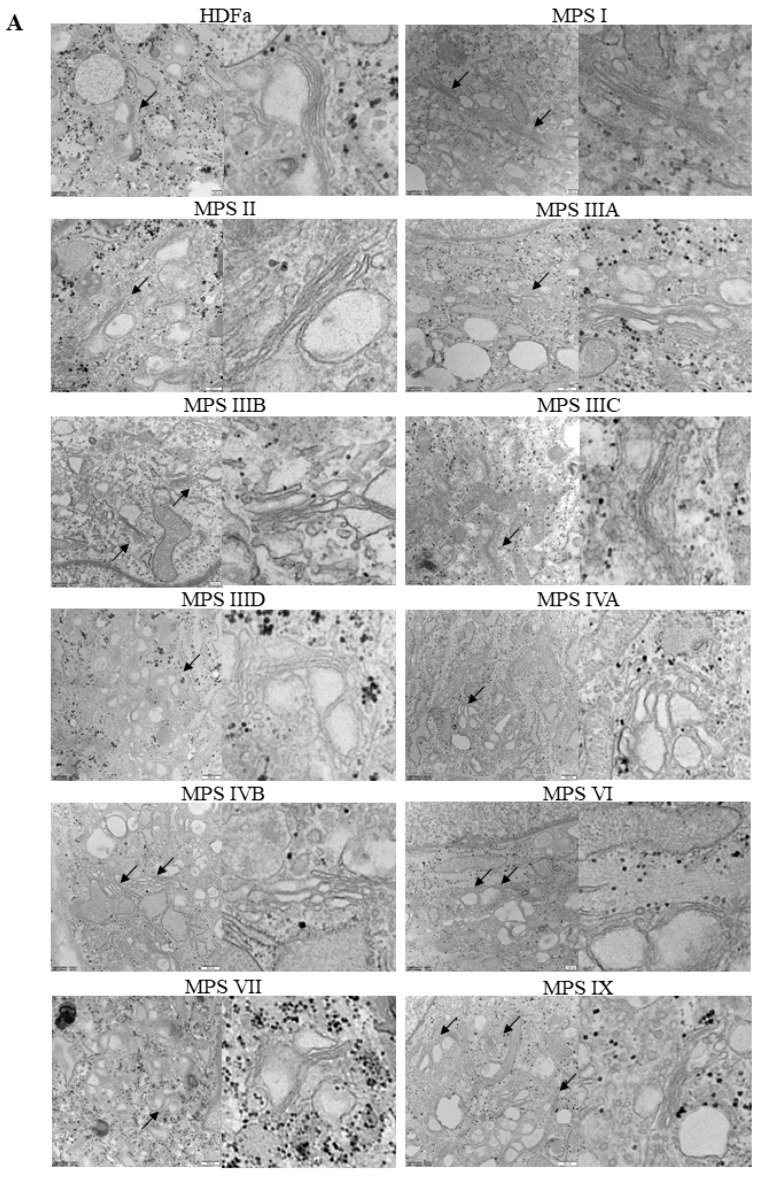
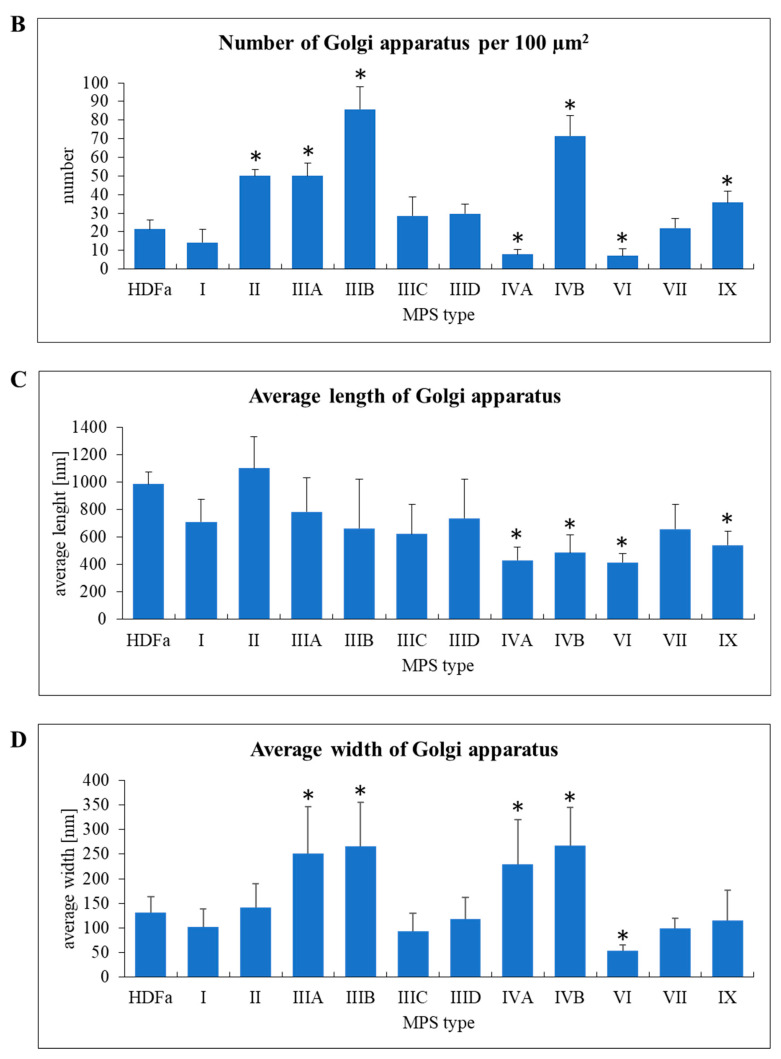
Figure 8.
Morphology of Golgi apparatus in MPS fibroblasts in comparison to control cells (HDFa cell line). Representative electron micrographs are presented in (A) (size bars represent 200 nm; arrows indicate Golgi structures). Quantification of changes in Golgi structures is presented in (B–D), indicating their number (B), length (C) and width (D). Mean values ± SD are presented, with asterisks representing statistically significant (p < 0.05) differences relative to the HDFa control.


