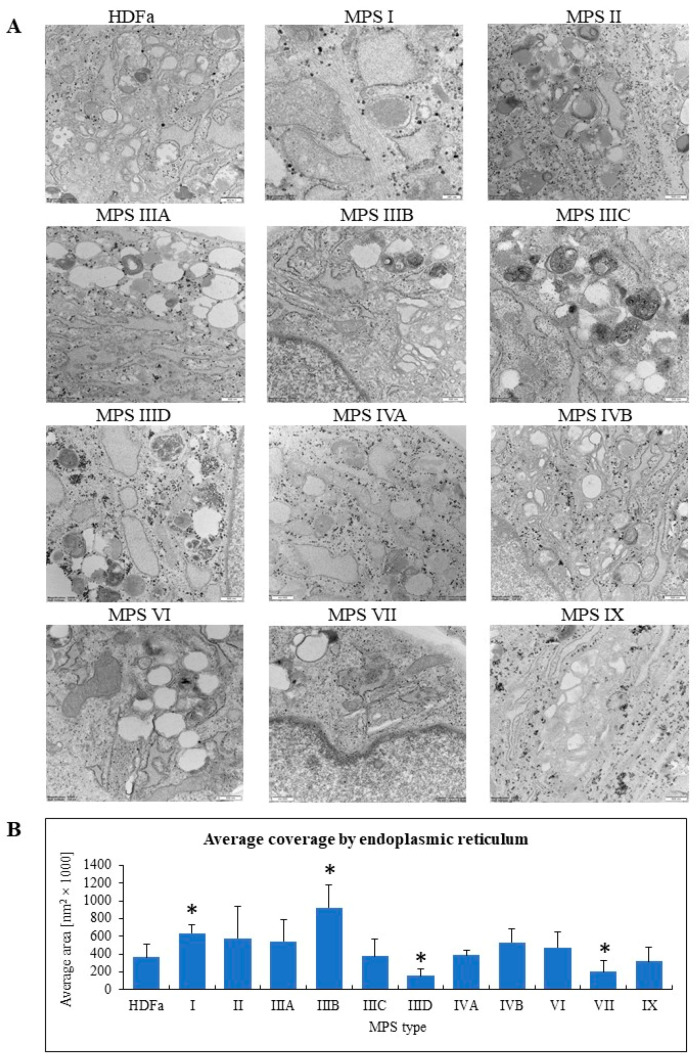
Figure 9.
Morphology of endoplasmic reticulum in MPS fibroblasts in comparison to control cells (HDFa cell line). Representative electron micrographs are presented in (A) (size bars represent 500 nm). Quantification of changes in endoplasmic reticulum is presented in (B). Mean values ± SD are presented, with asterisks representing statistically significant (p < 0.05) differences relative to the HDFa control.

