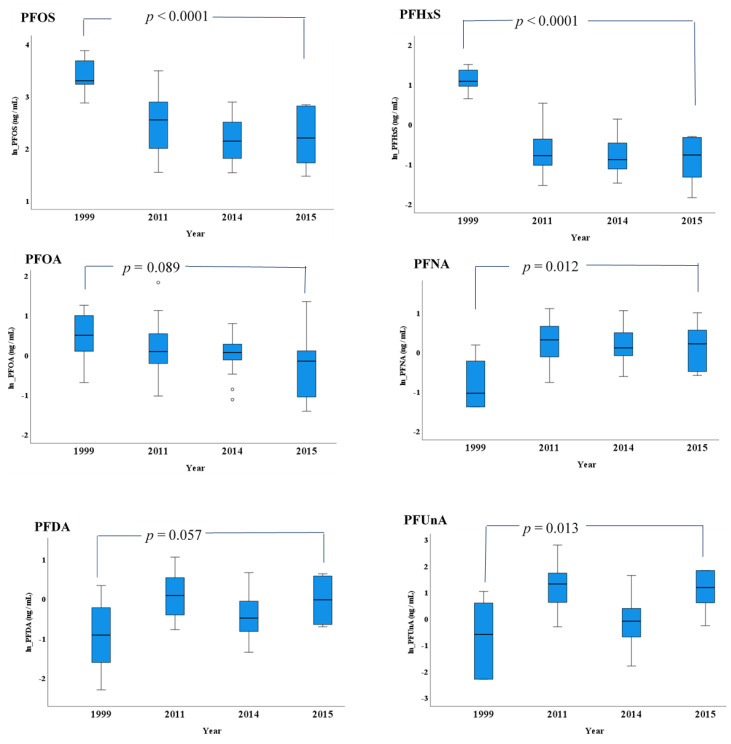
Figure 4.
The levels of PFASs in Ilulissat women in 1999 (n = 10), 2011 (n = 33), 2014 (n = 20) and 2015 (n = 6). The boxes display the 25th and 75th centiles, and the line inside the boxes represents the median value. The whiskers display the lower and upper values within 1.5 times the interquartile range beyond the box. The data are raw data and in ln-transformed scale. The figure in normal scale is given as Figure S3. The p values are from analysis of covariance (ANCOVA) on ln-transformed data under the adjustment of age. PFASs: perfluoroalkylated substances. For the full name of single PFAS congeners, please refer to the abbreviation list.

