
Figure 2. Overview of the RAP-sensitive and MIC-regulated phosphoproteome.
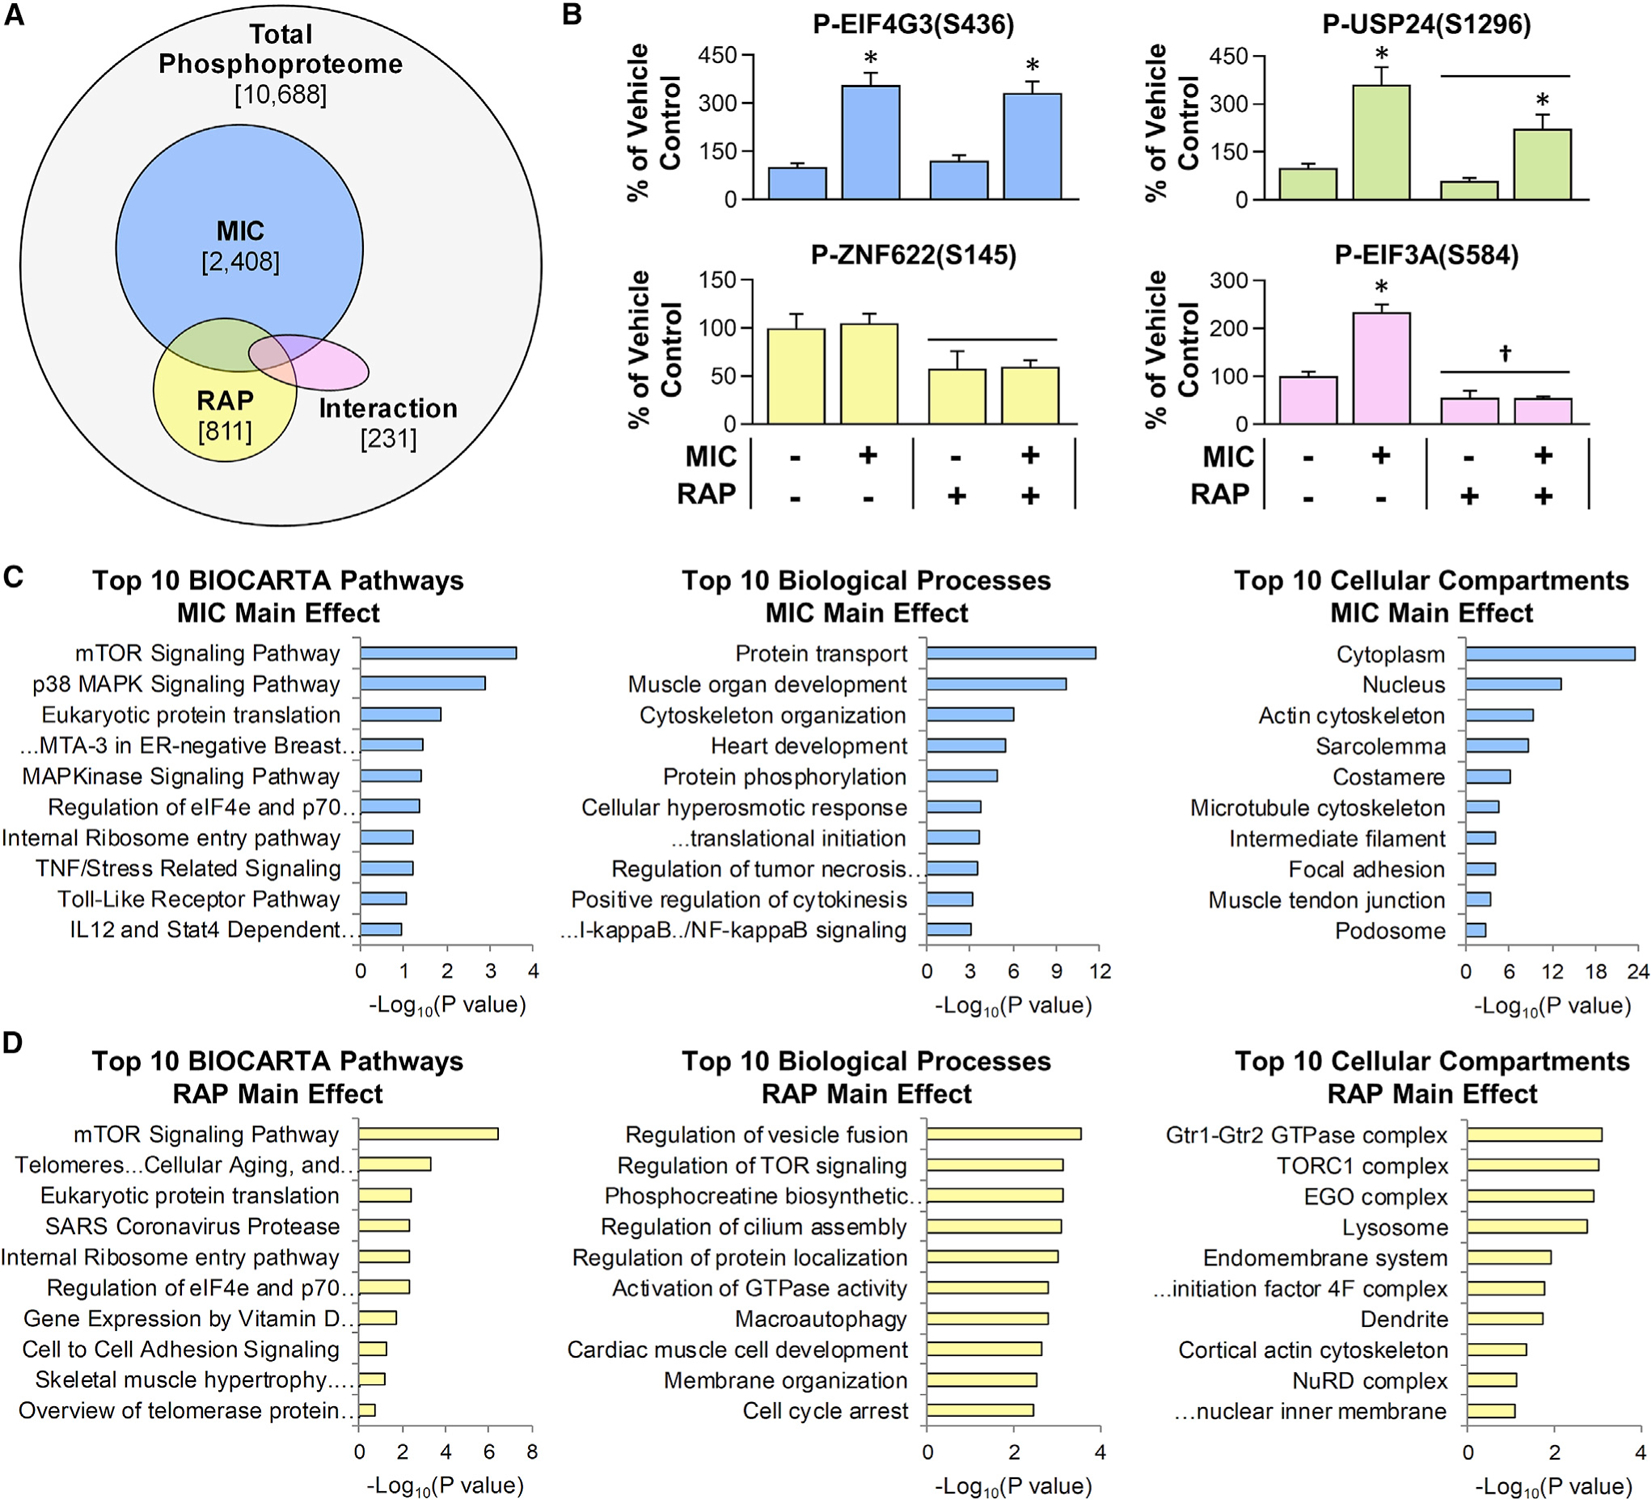
Mice were subjected to the workflow described in Figure 1, and the results were analyzed with two-way ANOVA. (A) Venn diagram indicates the total number of phosphopeptides that were quantified, along with the number of phosphopeptides that revealed a significant main effect for MICs (blue) or RAP (yellow) or a significant interaction between MIC and RAP (pink).
(B) Representative phosphorylation events for each of the categories identified in (A) (e.g., the graph with blue bars provides an example of a phosphorylation site that revealed a significant main effect for MIC, etc.). Values in the graphs represent the group mean + SEM, n = 4–6/group. Horizontal bar indicates a significant effect for RAP, asterisk (*) indicates a significant effect of MIC, and dagger (†) indicates a significant interaction between RAP and MIC, p < 0.05.
(C and D) Enrichment analyses were performed to identify the pathways, biological processes, and cellular compartments that were overrepresented with phosphorylation sites that revealed a significant main effect for MIC (C) or a significant main effect for RAP (D). Values in (C) and (D) represent the false discovery rate (FDR)-corrected p values with the “Top 10” being based on the lowest p values. Note: no pathways, biological processes, or cellular compartments were significantly overrepresented within the list of phosphorylation sites that revealed a significant interaction between MIC and RAP.