
Figure 6. The loss of TRIM28 leads to a reduction in myofiber size and attenuates the hypertrophic effect of MTE.
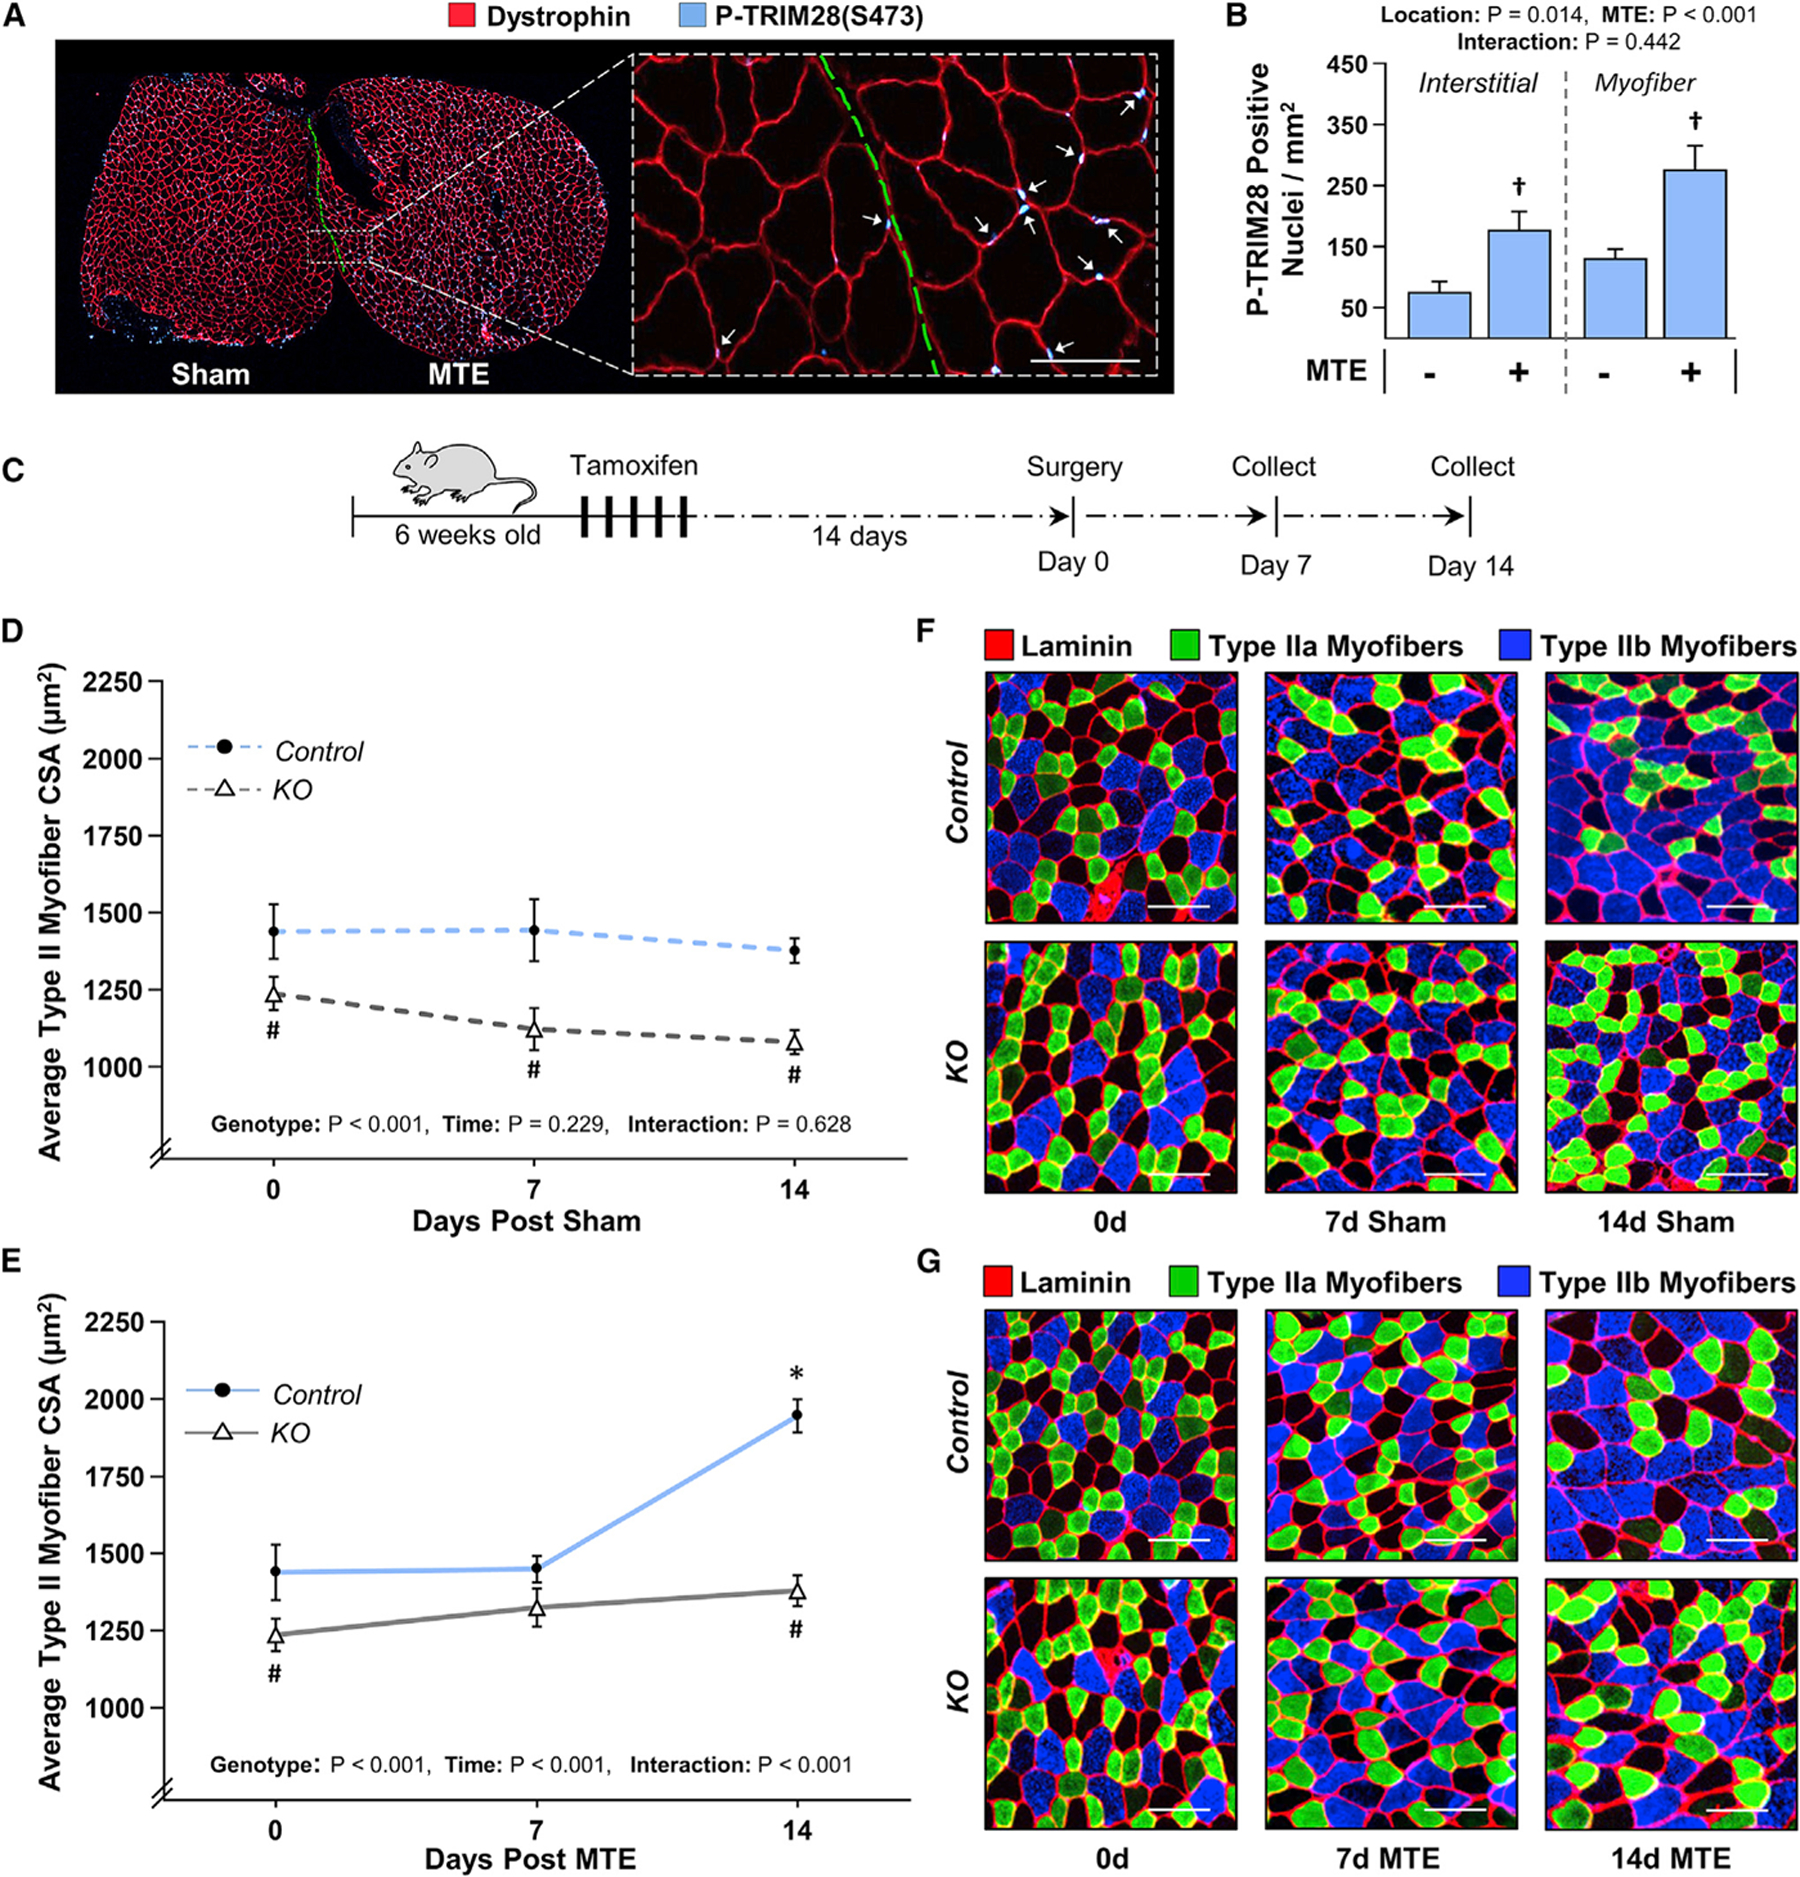
(A) The PLT muscles of wild-type C57BL/6 mice were subjected to myotenectomy (MTE) or a sham surgery. After 90 min of recovery, individual MTE and sham muscles were frozen adjacent to one another and then mid-belly cross sections were subjected to IHC for dystrophin and P-TRIM28(S473). Arrows indicate P-TRIM28(S473)-positive nuclei within the myofibers. Scale bar, 100 μm.
(B) The images in (A) were used to quantify the number of P-TRIM28(S473)-positive nuclei within the myofibers and the interstitial space. Values are presented as the group mean + SEM, n = 4/group. (C) TRIM28 KO mice and their control littermates were treated with tamoxifen for 5 days. At 14 days post tamoxifen, their PLT muscles were subjected to MTE or a sham surgery.
(D and E) After 0, 7, or 14 days of recovery, mid-belly cross sections of the PLT muscles were subjected to IHC for laminin and myofiber type identification. The mean CSA of each myofiber type (i.e., types IIa, IIx, and IIb) was determined and then the average of these values was used to calculate the “type II myofiber CSA.” Values represent the group mean ± SEM, n = 9–14 muscles/group (1,840–3,680 myofibers/group). Note: the individual myofiber type data are shown in Figures S5 and S6.
(F and G) Representative images of the cross sections that were stained for laminin, type IIa, and type IIb myofibers. Scale bars, 100 μm. The data in (B), (D), and (E) were analyzed with two-way ANOVA followed by Student-Newman-Keuls post hoc analyses. Significantly different from †sham, #time-matched control genotype, *day 0 within a given genotype, p < 0.05.