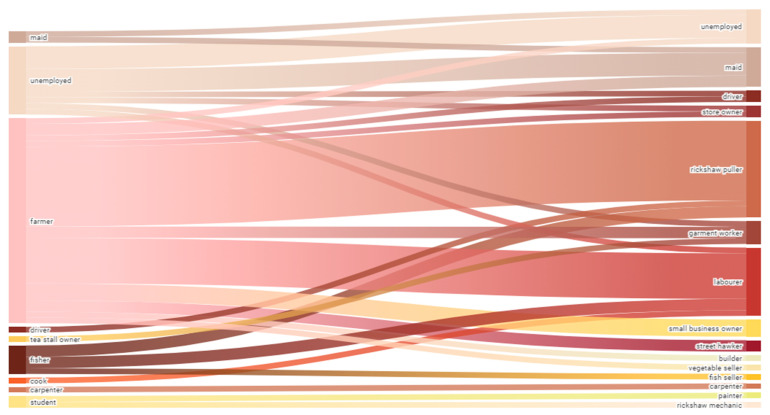
Figure 2.
Change in employment pre-migration (origin) to post-migration (destination). Sankey Diagram: The left represents the occupations of participants before migration (at the origin in Bhola) and on the right, the occupations of participants post-migration (at destination in Dhaka). The width of the streams represents the number of participants involved in that transition. A few participants had more than one occupation at origin and destination, in which case, the transition stream was duplicated.

