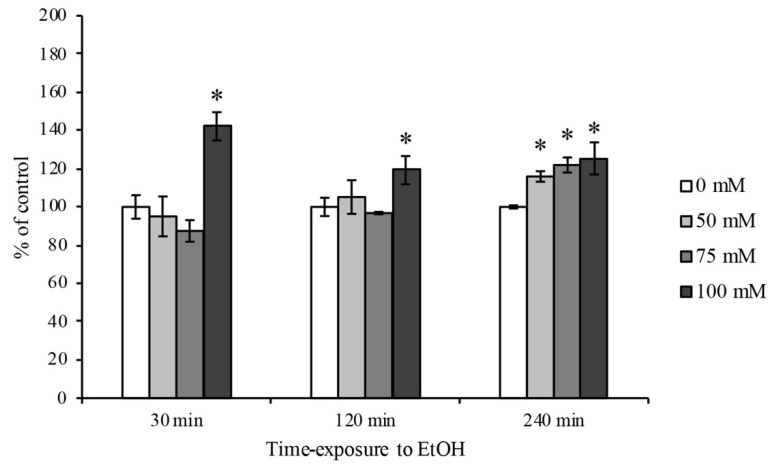
Figure 2.
ROS quantification on RBE4 cells after EtOH treatment. Representative ROS production by H2DCFDA fluorescence probe after EtOH (50, 75 and 100 mM) treatment at 30 min, 2 and 4 h timepoints. The reported values are expressed in percentage of control (untreated cells) as the mean ± S.E.M. of three independent experiments in triplicate. * p < 0.05 vs. control for each timepoint.

