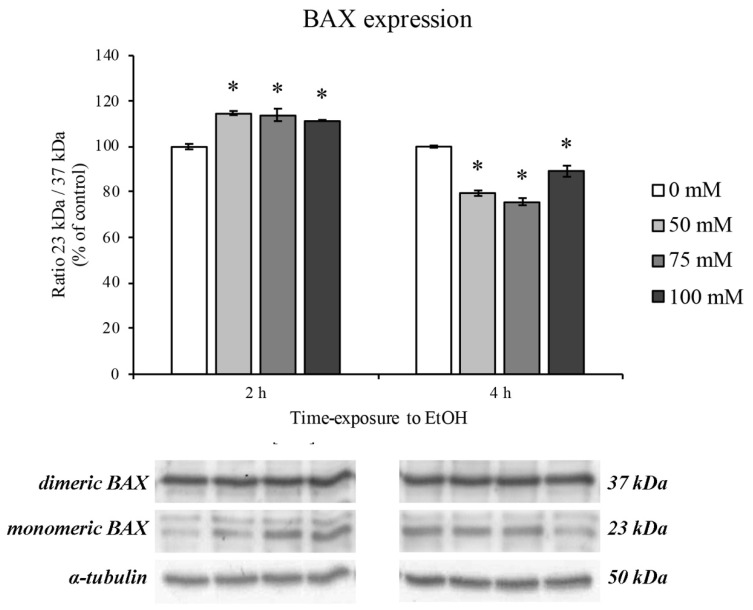
Figure 3.
Bcl-2-associated protein (BAX) expression on RBE4 cells after EtOH treatment. Representative Western blotting analysis of the EtOH (50–100 mM) effects on the protein levels of dimeric (upper bars) and monomeric (lower bars) BAX after 2 and 4 h of treatment. Value bars are expressed in percentage of control (untreated cells) as the mean ± S.E.M. of three independent experiments in triplicate. * p < 0.05 vs. control.

