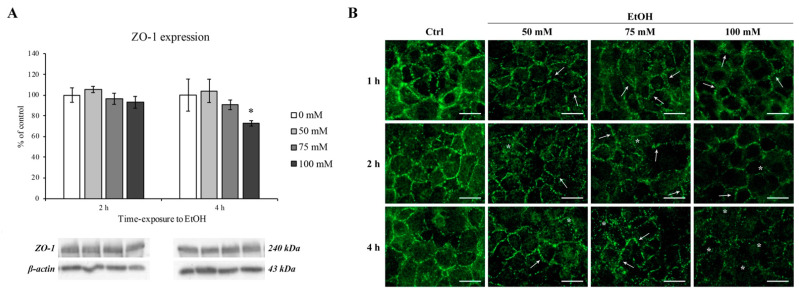
Figure 8.
ZO-1 expression and immunofluorescent staining on RBE4 cells after EtOH treatment. (A) Western blotting analysis and quantification of ZO-1 after EtOH (50, 75 and 100 mM) exposure at 2 and 4 h. Values are expressed in percentage of control (untreated cells) as the mean ± S.E.M. of three independent experiments in triplicate. * p < 0.05 vs. control. (B) Changes in ZO-1 distribution were evaluated after EtOH (50, 75 and 100 mM) treatments at 1, 2, and 4 h in comparison to control (untreated cells). Arrows show the “zip-like” structure as indicative for morphological alterations in intercellular junctions. Asterisks show the presence of holes formed between endothelial cells. Scale bar: 25 µm.

