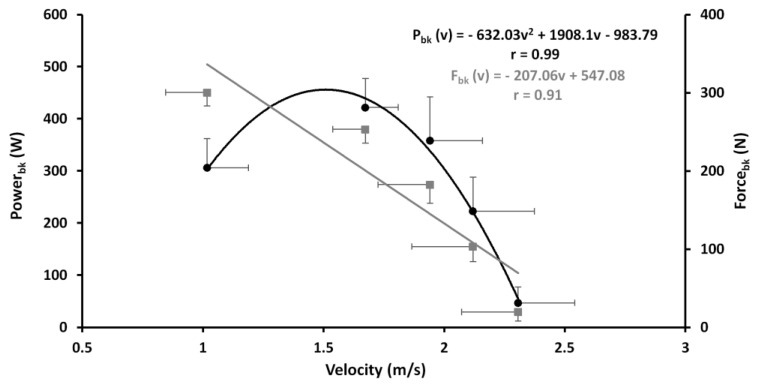
Figure 3.
Linear F-v (grey line and squares) and second-order polynomial regression P-v (black line and dots) with the relative regression equations building on vertical thrust performed at incremental loads (from 5 to 25 kg). Both curves are depicted according the average and SD of velocity, force and power at different load as shown in Table 1.

