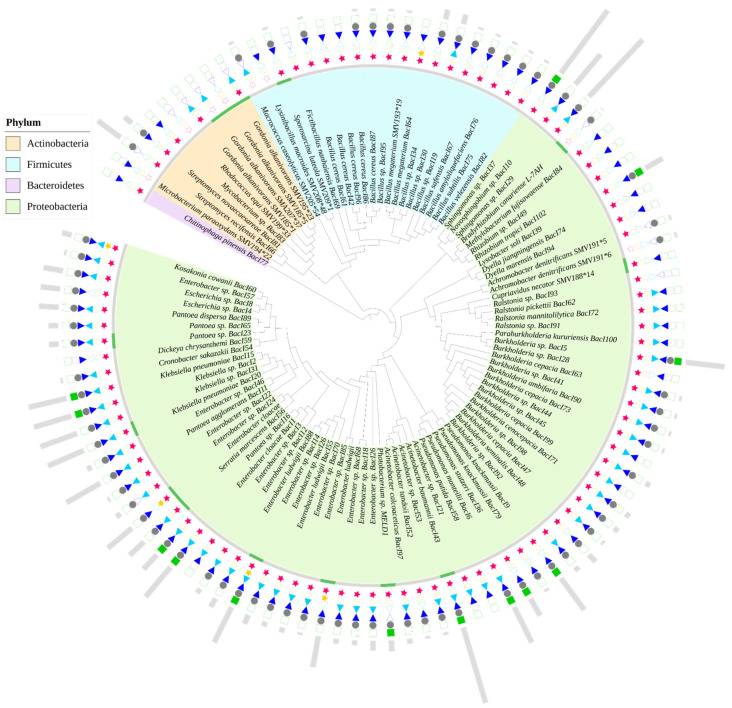
Figure 2.
Neighbor-Joining tree, based on Poisson model, of bacterial isolates investigated for their Hg phytoremediation enhancement potential. The full/empty symbols represent the presence/absence of traits relevant to Hg phytoremediation: red ★—IAA production, yellow ★—siderophore production, light blue ◀—N2 fixation, dark blue ▶—NH3 production, grey ●—Hg resistance, green ▄—merA. The green bands in the grey ring represent the isolates that were tested for their improvement of Hg phytoremediation, while the external grey bars represent the minimum inhibitory concentration value for Hg. The tree was generated in MEGA X [157], using 16S DNA sequences collected from [41,42,47,56,147], and processed in iTOL [158].

