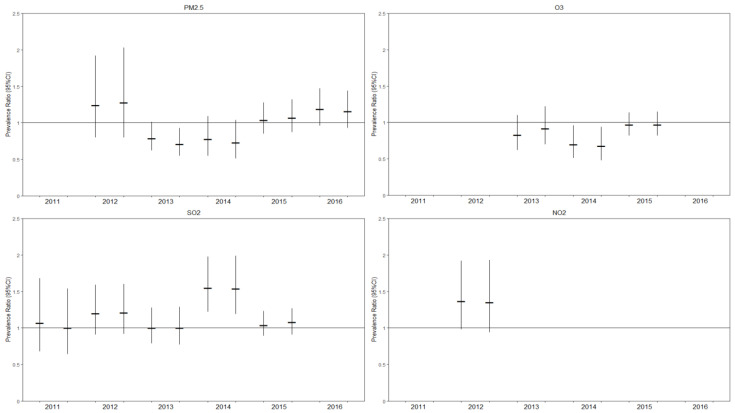
Figure 1.
Crude and adjusted estimates of the prevalence ratio between increased outdoor air pollution and depression, with corresponding 95% confidence intervals). The annual crude and adjusted estimates are reported on the left and right, respectively; Potential covariates included: continuous age (centered at 15 years), sex, marital status, total household income, education, employment status, urban versus rural households, cigarette smoking, and chronic illness.

