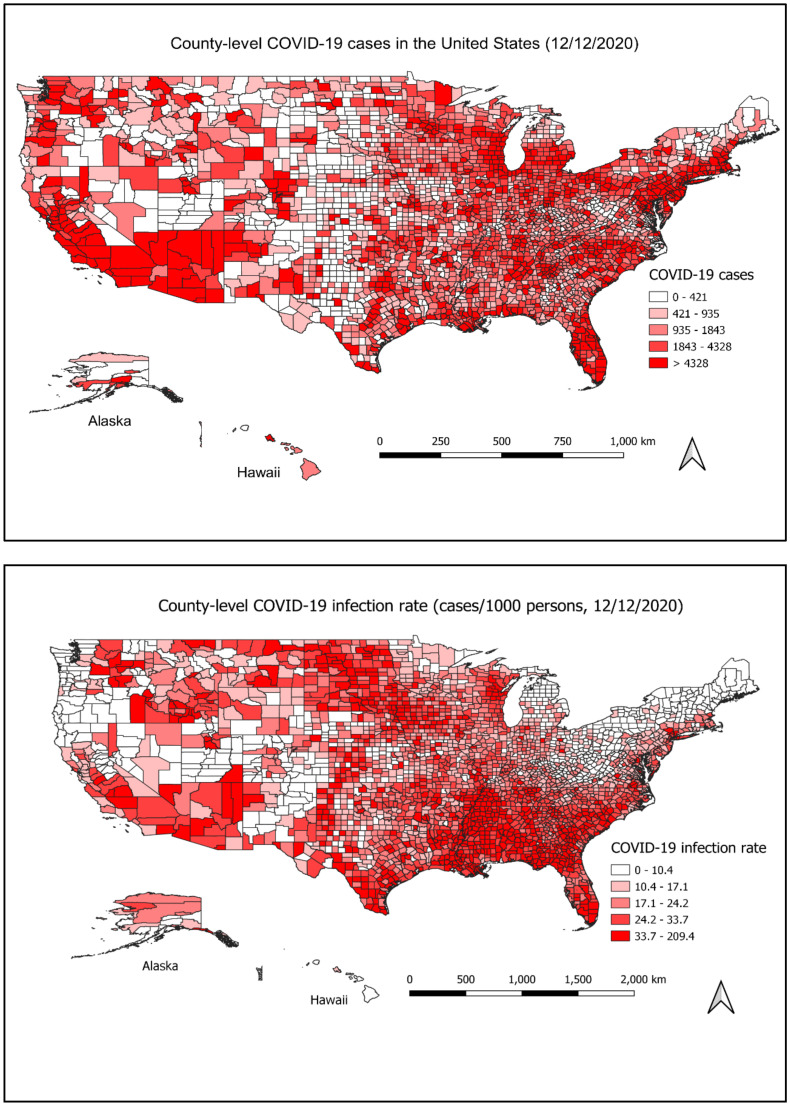
Figure 1.
The county-level of COVID-19 cases and rates in the U.S on 12 December 2020. The map on the top shows the number of COVID-19 cases on 12 December 2020, in each county. The map on the bottom shows the infection rate of COVID-19 on 12 December 2020 in each county. The number of cases and the infection rate were divided into five categories and illustrated by red color from light (low number) to deep (high number), respectively.

