Figure 2.
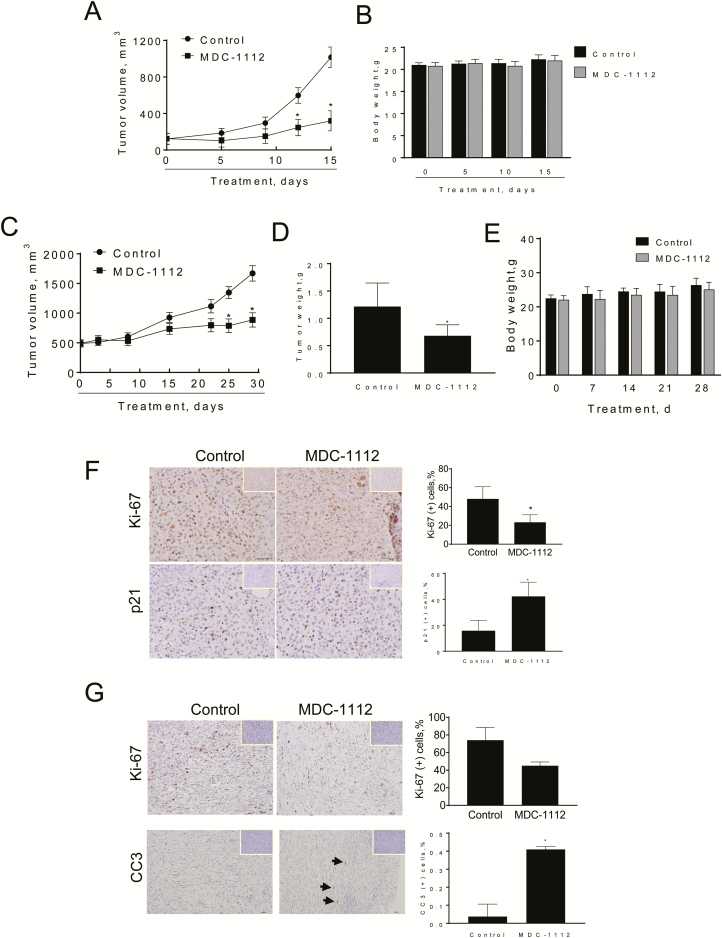
MDC-1112 reduces GBM xenograft growth. (A) MDC-1112 inhibits the growth of human U87 xenografts. U87 cells were injected s.c. into the flank areas of nude mice, and when palpable tumors were observed, the mice received MDC-1112 (50 mg/kg per day) in PBS or just PBS (control) by intraperitoneal injection for 15 days. U87 tumor volume growth over time for vehicle control- and MDC-1112-treated mice. *Significantly different compared with control group [P < 0.01, one-way analysis of variance (ANOVA) test]. (B) Mice weight progression for control and MDC-1112-treated mice. (C) MDC-1112 inhibits the growth of human U118 xenografts. U118 cells were injected s.c. into the flank areas of nude mice, and when palpable tumors were observed, the mice received MDC-1112 (50 mg/kg per day) in PBS or just PBS (control) by intraperitoneal injection for 30 days. U118 tumor volume growth over time for vehicle control- and MDC-1112-treated mice. *Significantly different compared with control group (P < 0.01, one-way ANOVA test). (D) Tumor weight at sacrifice. *Significantly different compared with control group (P < 0.01, one-way ANOVA test). (E) Body weight over time of mice bearing U118 xenografts treated with vehicle control (PBS) or MDC-1112 50 mg/kg. All values: mean ± SD. (F) Ki-67 and p21 immunostaining were performed on U87 tumor sections and photographs were taken at ×20 magnification. Representative images are shown. The consecutive section was stained with isotype IgG as negative staining control and it is shown in the upper right corner. Quantification is displayed on the right. Results were expressed as percent of Ki-67+ or p21+ cells ± SEM per ×20 field. *Significant compared with control group; P < 0.05. (G) Ki-67 and cleaved caspase 3 (CC3) immunostaining were performed on U118 tumor sections and photographs were taken at ×20 magnification. Representative images are shown. The consecutive section was stained with isotype IgG as negative staining control and it is shown in the upper right corner. Quantification is displayed on the right. Results were expressed as percent of Ki-67+ cells ± SEM per ×20 field. *Significant compared with control group; P < 0.05.

