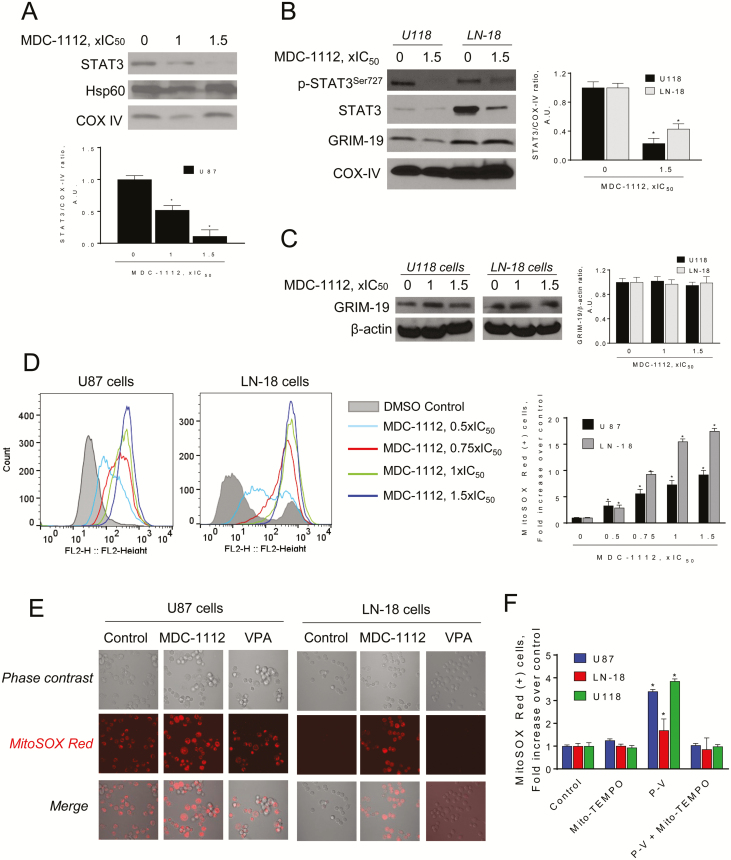
Figure 5.
MDC-1112 reduces mitochondrial STAT3 levels and induces mitochondrial ROS in GBM cells. (A) Immunoblots for STAT3, Hsp60 or COX IV in mitochondrial (MF) fractions from U87 cells treated with MDC-1112 for 3 h. Bands were quantified and results expressed as percent control for each protein. Values are mean ± SEM. *P < 0.05 versus control. (B) Immunoblots for STAT3, phosphorylated STAT3 at the Ser727 residue (p-STAT3Ser727), GRIM-19 and COX IV in MF from U118 and LN-18 cells treated with MDC-1112 for 3 h. Bands were quantified and results expressed as percent control for each protein. Values are mean ± SEM. *P < 0.05 versus control. (C) Immunoblots of GRIM-19 in total fractions from U87 cells treated with various concentrations of MDC-1112 for 4 h. Bands were quantified and results are shown as the ratio GRIM-19:β-actin. (D) U87 and LN-18 cells were treated with MDC-1112 for 1 h as indicated. The levels of superoxide anion in the mitochondria were determined by flow cytometry using the MitoSOX-Red fluorescent probe. Bar graph analysis of Geometric means of cells that underwent MitoSOX Red Staining. (E) U87 and LN-18 cells were treated without (Control) or with MDC-1112 1 × IC50 or VPA (1 × IC50) for 1 h. Superoxide anion levels in the mitochondria was determined by confocal microscopy. Representative images are shown. (F) Treatment with Mito-TEMPO prevents the increase in MitoSOX-Red induced by MDC-1112 in various GBM cells. Values are mean ± SEM. *P < 0.05 versus control.

