FIGURE 1.

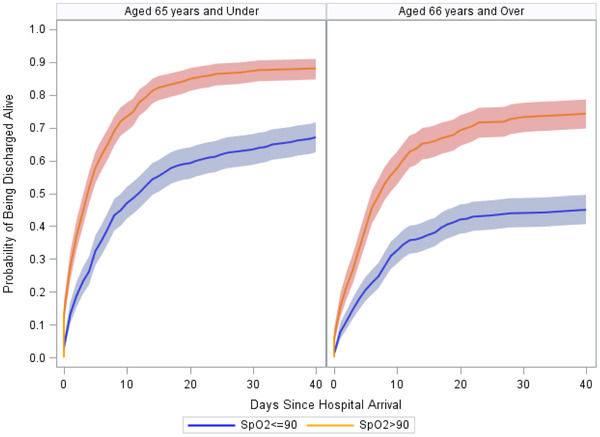
Cumulative incidence functions for the probability of being discharged from the hospital alive after accounting for death, by out‐of‐hospital SpO2 level and age. Shading represents 95% confidence intervals

Cumulative incidence functions for the probability of being discharged from the hospital alive after accounting for death, by out‐of‐hospital SpO2 level and age. Shading represents 95% confidence intervals