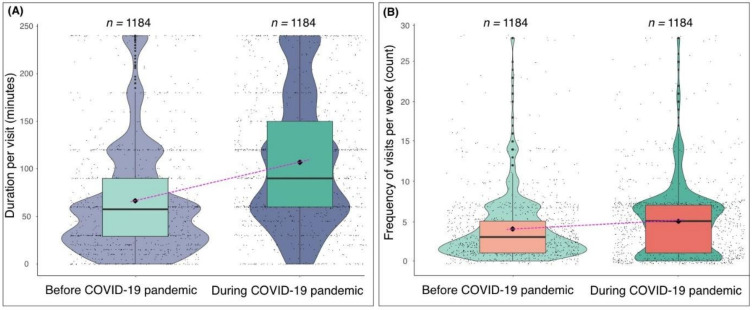
Figure 3.
Violin plots (A) typical duration spent in natural environments (e.g., parks, woodland) before (left) and during (right) the COVID-19 pandemic; and (B) typical frequency of visits to natural environments per week before (left) and during (right) the COVID-19 pandemic. The black diamond represents the mean value.

