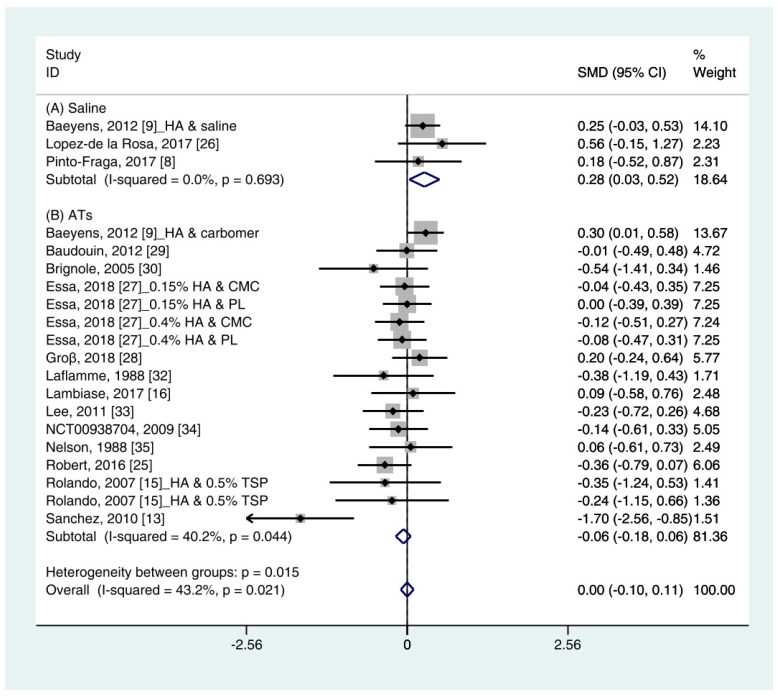
Figure 3.
Comparison of the changes on TBUT values (seconds) in HA and non-HA groups using the fixed effect model. The non-HA group was classified into (A) saline and (B) ATs depending on whether lubricant was included. Subgroup analysis was performed between HA and (A) saline and between HA and (B) ATs. TBUT: Tear break-up time; HA: Hyaluronic acid; ATs: Artificial tears; SMD: Standardized Mean Difference; CI: Confidence interval.

