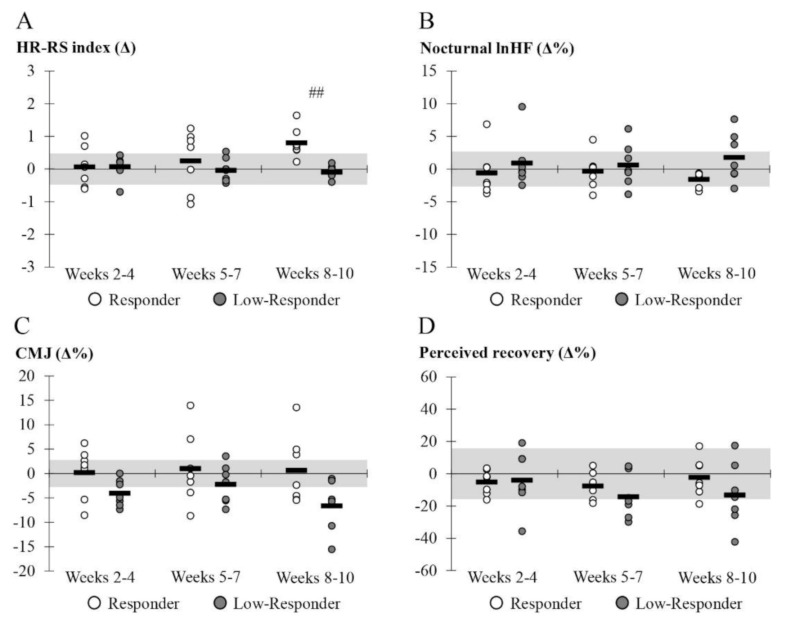
Figure 3.
Mean (black line) and individual values (dots) in the relative changes compared to the control period in the nocturnal HRV (lnHF), heart rate-running speed index (HR-RS index), countermovement jump (CMJ), and perceived recovery. The gray area represents the smallest worthwhile change. ## p < 0.01 in between-group comparison.

