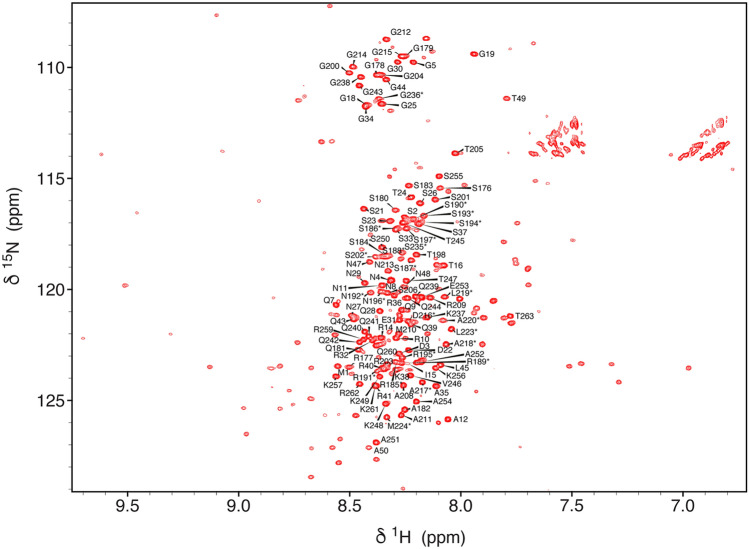
Fig. 2.
1H–15N BEST-TROSY of N123 (1–263) from SARS-CoV-2. The spectrum was acquired on a 950 MHz spectrometer at 298 K at a concentration of 150 μM in 50 mM Na-phosphate, pH 6.5, 250 mM NaCl. Backbone 1H–15N peaks assigned in this study are labelled, resonances transferred from assignment of N3 (Fig. 1) are starred. The disperse signals from N2 for which an assignment is already available (Dinesh et al. 2020) are present but have not been labelled

