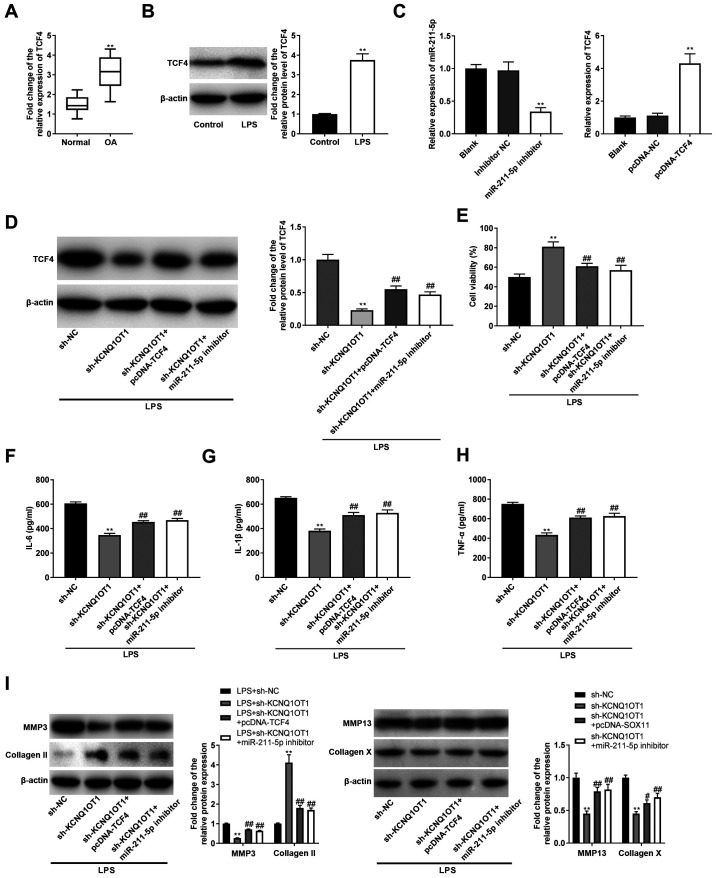
Figure 5.
KCNQ1OT1 indirectly regulates expression of TCF4 by competitively binding to miR-211-5p. (A) Relative expression level of TCF4 in OA cartilage tissues and normal cartilage tissues was determined by RT-qPCR. **P<0.01 vs. normal. (B) Relative protein expression level of TCF4 in C28/I2 cells was determined by western blotting. **P<0.01 vs. control. (C) Expression levels of miR-211-5p and TCF4 were detected by RT-qPCR. **P<0.01 vs. inhibitor NC or pcDNA-NC. (D) Relative protein expression level of TCF4 in transfected C28/I2 cells were determined by western blotting. **P<0.01 vs. LPS + sh-NC; ##P<0.01 vs. LPS + sh-KCNQ1OT1. (E) Cell viability was assessed by MTT assay. **P<0.01 vs. LPS + sh-NC; ##P<0.01 vs. LPS + sh-KCNQ1OT1. Levels of (F) IL-6, (G) IL-1β and (H) TNF-α in culture medium were measured by ELISA. **P<0.01 vs. LPS + sh-NC; ##P<0.01 vs. LPS + sh-KCNQ1OT1. (I) Protein expression levels of MMP-3, MMP-13, collagen X and collagen II were detected by western blotting. **P<0.01 vs. LPS + sh-NC; ##P<0.01 vs. LPS + sh-KCNQ1OT1. miR, microRNA; OA, osteoarthritis; LPS, lipopolysaccharide; RT-qPCR, reverse transcription-quantitative polymerase chain reaction; sh, short hairpin RNA; NC, negative control; KCNQ1OT1, KCNQ1 opposite strand/antisense transcript 1; TCF4, transcription factor 4; MMP, matrix metalloproteinase.

