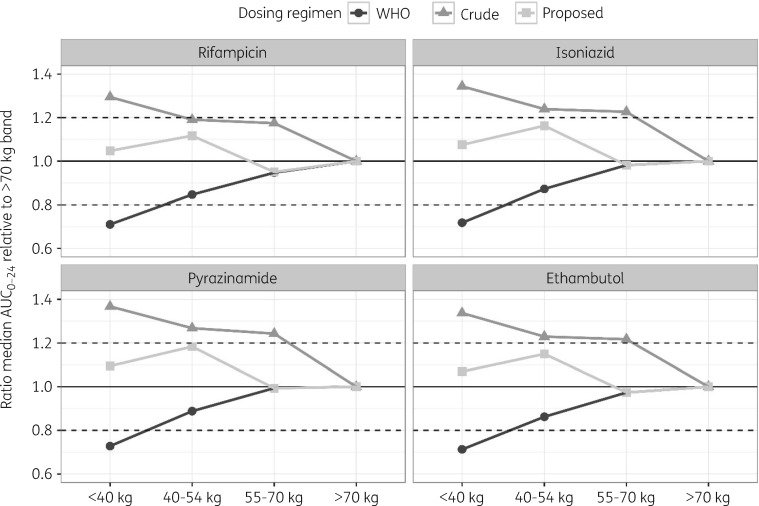
Figure 3.
Comparison of predicted relative variability in median steady-state exposure across the trial population following the proposed adjusted dosing regimens (filled squares) versus regimens based on the WHO-recommended weight band (filled circles) and a cut-off value of 50 kg (filled triangles). Patients in the highest WHO weight band (>70 kg) were selected as the reference population. Dashed horizontal lines represent the variability acceptance interval (80%–120%).

