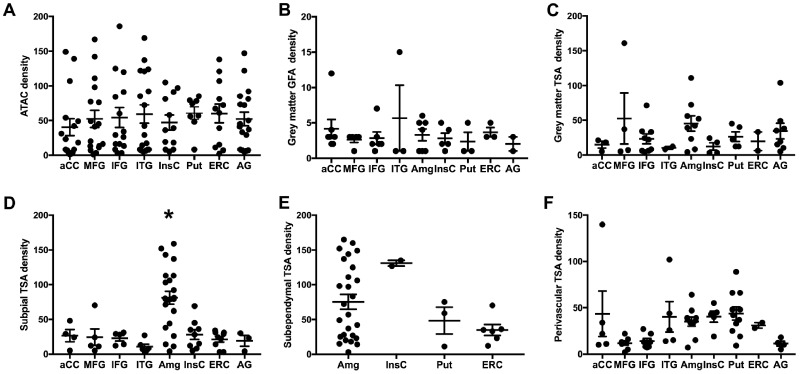
FIGURE 3.
Anatomical distribution of astrocytic tau deposition by subtype and density. The cases with a nonzero density are plotted by region for argyrophilic thorny astrocyte clusters (ATAC)/white matter ARTAG (A), grey matter granular fuzzy astrocytes (GFA) (B), grey matter thorn-shaded astrocytes (TSA) (C), subpial TSA (D), subependymal TSA (E), and perivascular TSA (F). Each case with a nonzero density is represented with a symbol; solid lines indicate the mean and standard error of the mean. Asterisk indicates all Tukey post hoc comparisons of amygdala deposition with every other area (p < 0.05).

