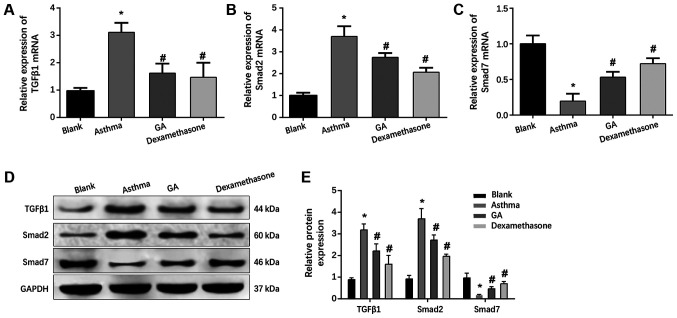
Figure 3.
Expression levels of TGF-β1, Smad2 and Smad7 in lung tissues of mice. mRNA levels of (A) TGF-β1, (B) Smad2 and (C) Smad7 in mouse lung tissues of each group were detected via reverse transcription-quantitative PCR analysis. (D) Protein levels of TGF-β1, Smad2 and Smad7 in mouse lung tissues of each group were detected via western blot analysis. (E) The gray value of protein bands among groups was assessed. *P<0.05 vs. blank group; #P<0.05 vs. asthma group. TGF-β1, transforming growth factor-β1.

