
Figure 3.
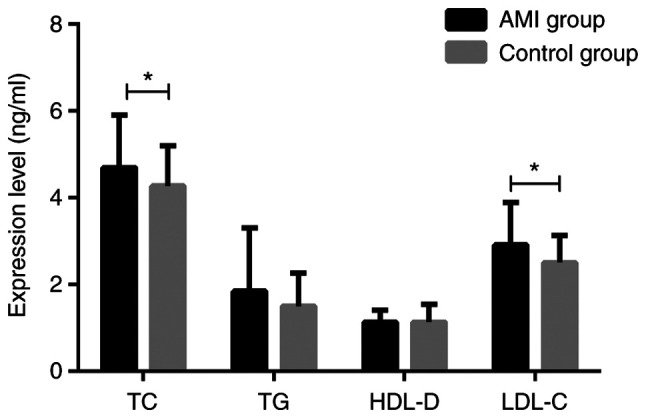
Comparison of the expression levels of blood lipids in the two groups of patients. The t-test was used for analysis. There was a statistically significant difference in TC and LDL-C (both P<0.05), while there was no significant difference between TG and HDL-D (both P>0.05) between the AMI group and the control group. *P<0.05. TC, total cholesterol; TG, triglyceride; LDL-C, low-density lipoprotein cholesterol; HDL-D, high-density lipoprotein cholesterol; AMI, acute myocardial infarction.