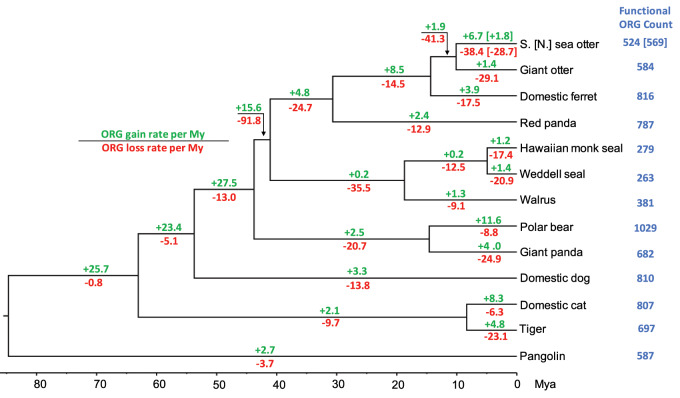
Fig. 3.
Rates of gain and loss of functional ORGs. Rates of ORG gain and loss per million years are shown for each branch of the phylogeny. These rates are calculated by dividing the counts of functional ORG gained or lost (supplementary fig. S6, Supplementary Material online) by the branch lengths calculated from the mean node ages (fig. 1). Rates are shown for both the southern (“S.”) and northern (“N.”) sea otter genomes, with the latter in brackets. The total number of functional ORGs in each species is shown to the right of the phylogeny.

