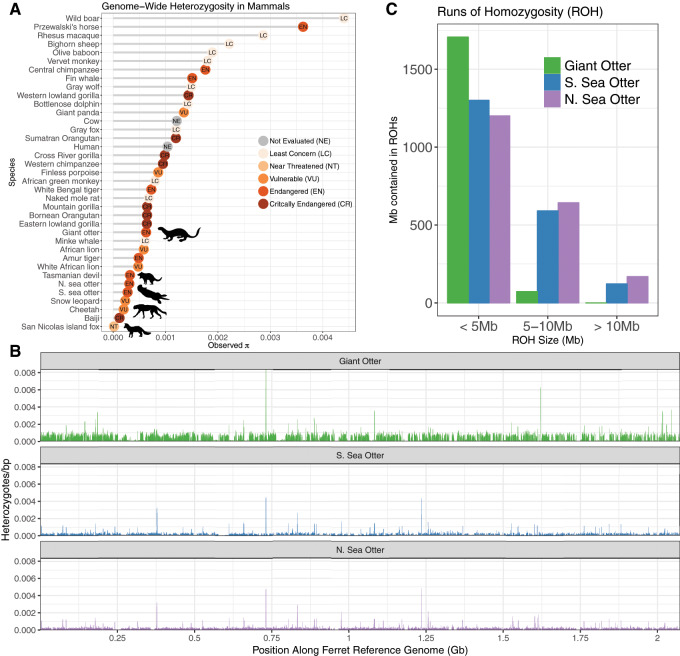
Fig. 4.
Genomic diversity in the southern sea otter and giant otter. (A) Comparison of genome-wide heterozygosity in sea otter, giant otter, and other mammals drawn from the literature, based on Robinson et al. (2016). Dots are colored by the endangered status according to the International Union for Conservation of Nature (IUCN) Red List for Threatened Species. A full table of values with references can be found in supplementary table S8, Supplementary Material online. (B) Sliding window heterozygosity of the giant otter (green), southern sea otter (blue), northern sea otter (purple) sequencing reads mapped to the domestic ferret reference genome (220 scaffolds >3 Mb). (C) ROH across the largest 220 scaffolds (>3 Mb) of the domestic ferret reference genome. The ROH are binned by size of the run, and the y axis depicts the amount of sequence contained in ROH of that size.

