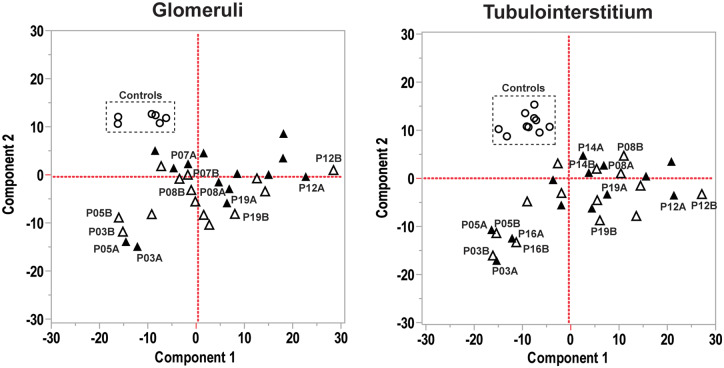
FIGURE 1.
Principal component analysis of immune gene expression in glomeruli and tubulointerstitium. In both compartments healthy controls clustered separately from LN biopsies. In contrast, transcript expression in LN did not cluster, but for some individual patients biopsy A (open triangles) and biopsy B (filled triangles) immune gene expression clustered closely.

